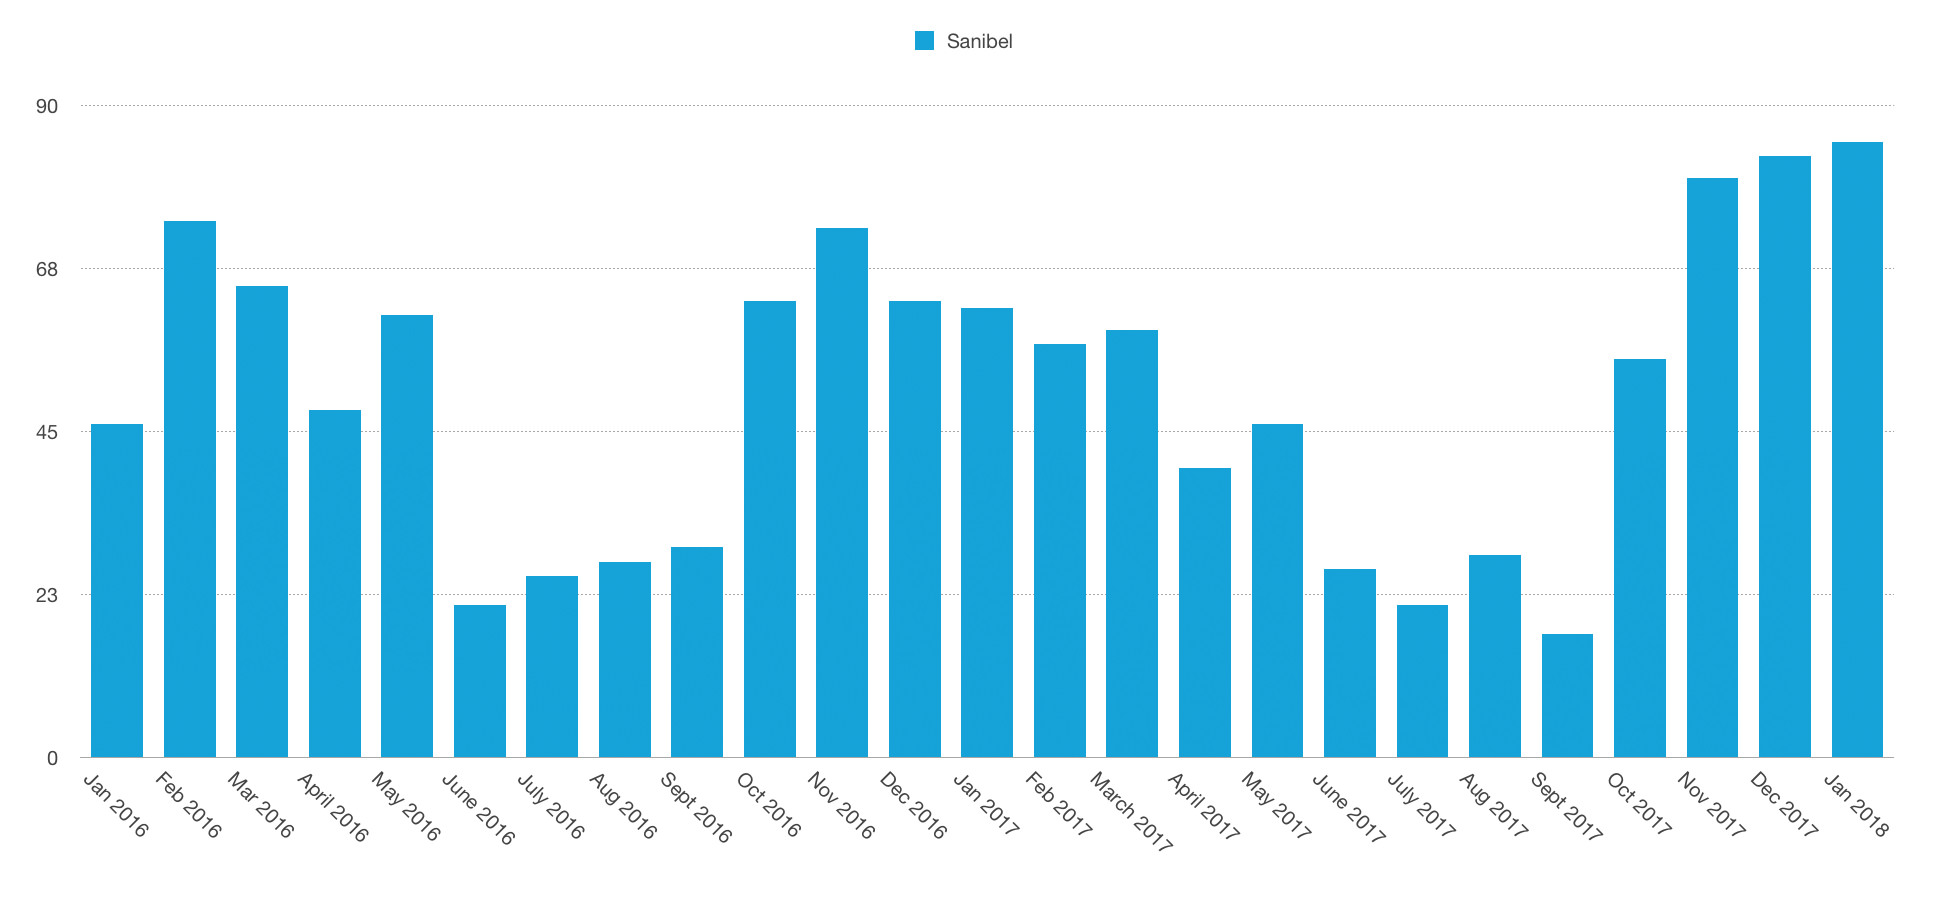
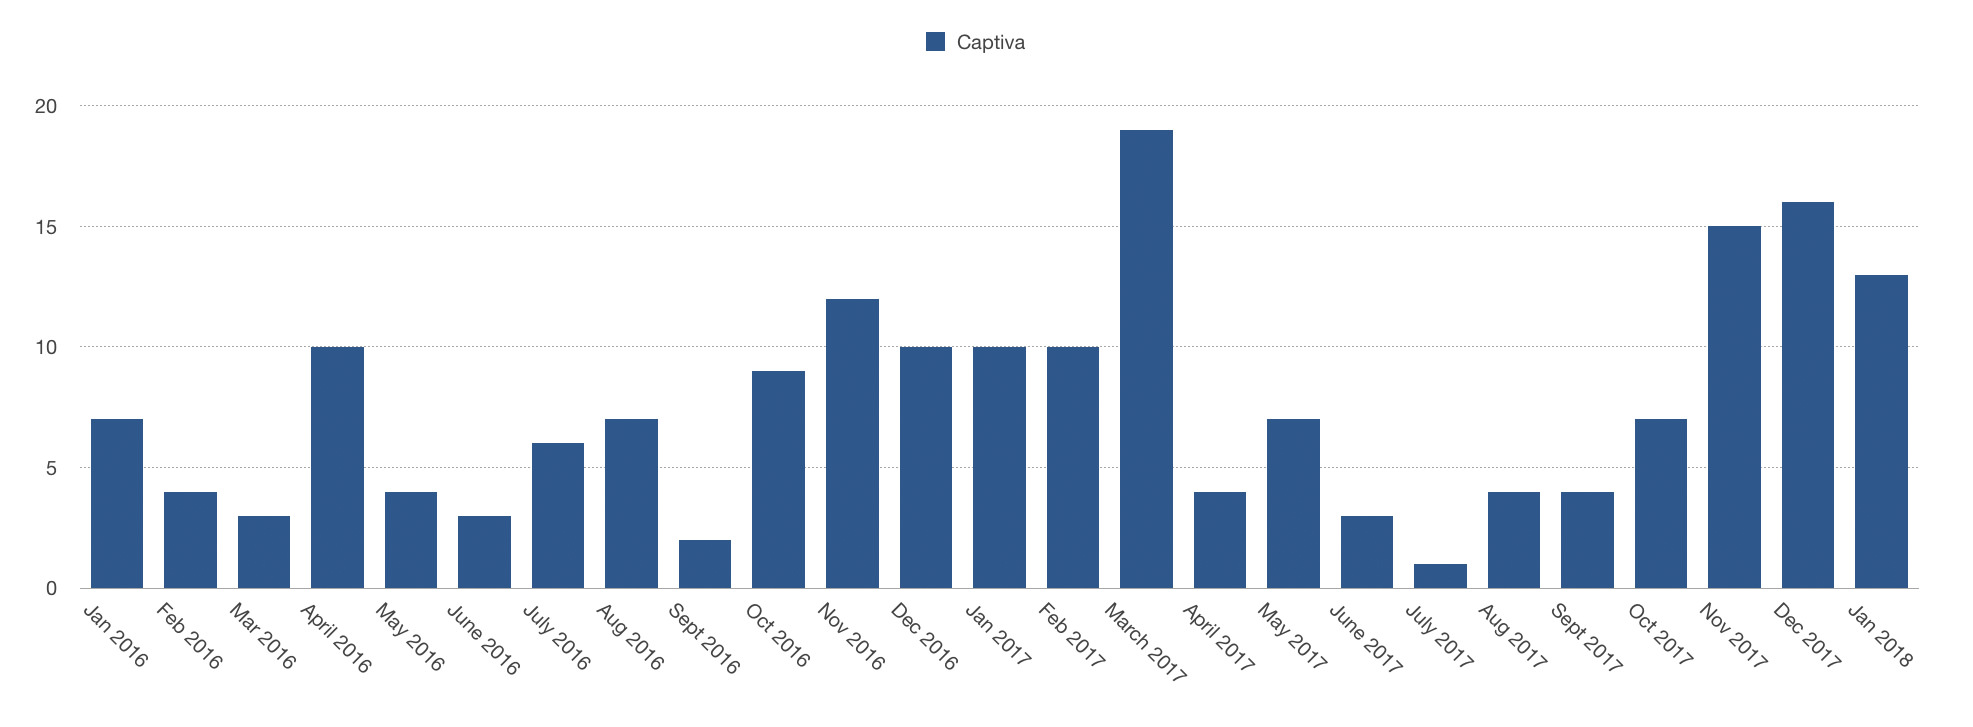
Sanibel and Captiva Islands had 98 new listings hit the market in January 2018! There were 85 new listings on Sanibel, and 13 on Captiva, which all together totaled an increase of 26 new listings from January 2017. Our data was pulled from the Sanibel-Captiva MLS and includes all new listings of residential properties, condos and vacant land.

Market Seasonality
As you know, it is “peak season” here on the islands, which usually coincides with a higher number of new listings entering the market. You might be wondering, “How does this season compare to last?” As far as new listings… there are more!
From October 2016 – January 2017, there were 302 new listings on Sanibel and Captiva. This season, between October 2017 – January 2018, we’ve seen 354 new listings on Sanibel and Captiva, which is an increase of 17% from last season. Really our season runs through April, but for comparisons we can see a clear increase in the number of new listings this season already.
New Listings Per Month
Below we show the number of new listings that hit the market each month for both Sanibel and Captiva over the past two years. You can see the general pattern of season, where more homes enter the market between October through May, and our slower months being June, July, August and September. (Click each graph to enlarge.)
New Listings By Area
Sanibel Island
So far this month (as of Feb 20, 2018) Sanibel has had 40 new listings hit the market. Below you can check out the latest listing by price range.
New listings between $400k – $500k
New listings between $500k – $750k
New listings between $750k – $1M
New listings between $1M – $1.5M
New listings between $1.5M – $2M
New listings between $2M – $3M
Captiva Island
So far this month (as of Feb 20, 2018) Captiva has had 40 new listings hit the market. Below you can check out the latest listing by price range.
New listings between $400k – $500k
New listings between $500k – $750k
New listings between $750k – $1M
New listings between $1M – $1.5M
New listings between $1.5M – $2M


