• Skip to primary navigation
  • Skip to main content
  • Skip to primary sidebar
(239) 472-1950 Login
Sanibel Real Estate Guide Logo

Sanibel Real Estate Guide

Find your Sanibel Home and Learn About Life on Our Island

  • Find Your Home
    • Real Estate Search
    • Island Condo Guide
    • Sanibel Map Search
  • Island Info
    • Island Living
    • Real Estate News
    • Sanibel & Captiva Market Report
    • Owning Vacation Rentals
    • Retiring On Sanibel
    • Sanibel New Resident Guide
  • About
    • Who We Are
  • Contact Us
  • Show Search
Hide Search
Home/What’s Sold On Sanibel – Fall 2016

What’s Sold On Sanibel – Fall 2016

As we head into our “busy season” here on the islands, we’ll start to see more and more homes come on the market. As you know, there’s a lot that is factored into deciding the “listing price” or “asking price” of a home. One of the biggest factors, of course, is the recent sales data of similar homes in the area. Homeowners often use these past sales prices as comparable figures to base the price and value of their own home.

sold-on-sanibel

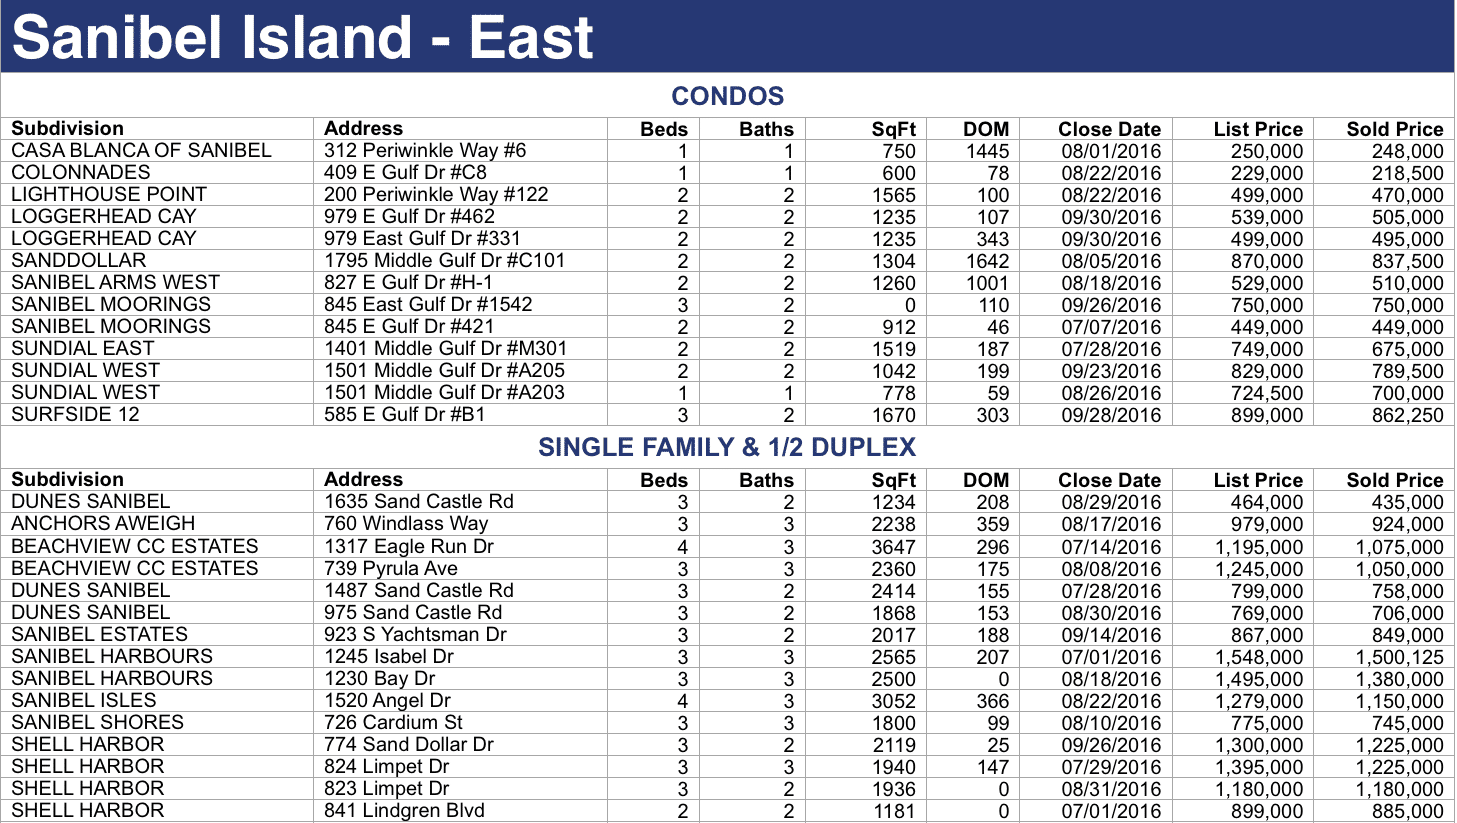
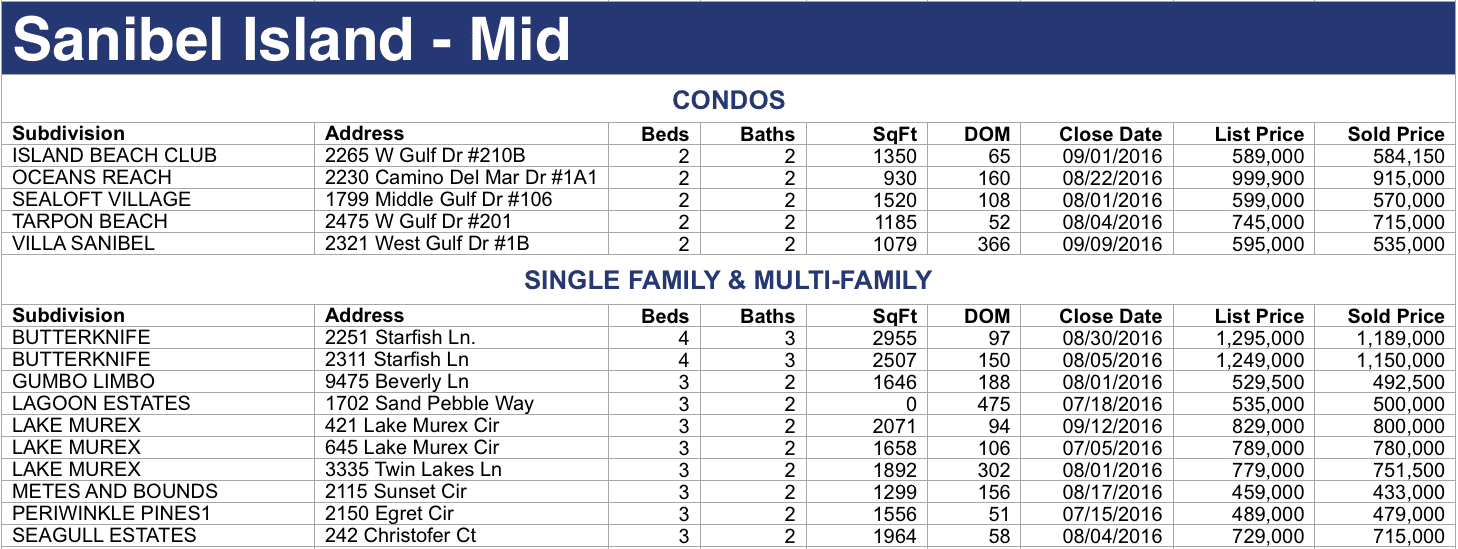
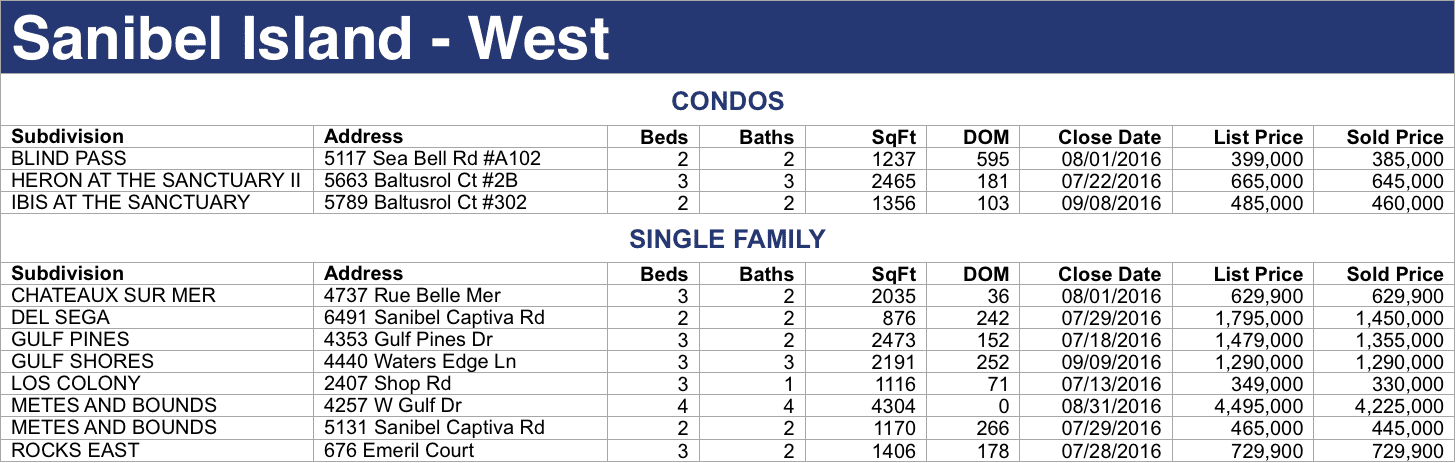
To help you in the process, I’ve listed all of the sales of single family homes, multi-family homes, 1/2 duplexes and condos that have occurred on Sanibel and Captiva over the last three months (August – October, 2016). It’s important to remember that these sales happened during our “slower months,” with a few atypical factors included such as the U.S. Presidential election, etc. Still, I think the data provides a solid look at the Sanibel and Captiva real estate market and is a good basis for homeowners to start their comparison.

(Click on each chart to enlarge)

captiva-market-fall2016

[thrive_lead_lock id=’10353′]

sanibel-east-market-fall2016

sanibel-mid-market-fall2016

sanibel-west-market-fall2016

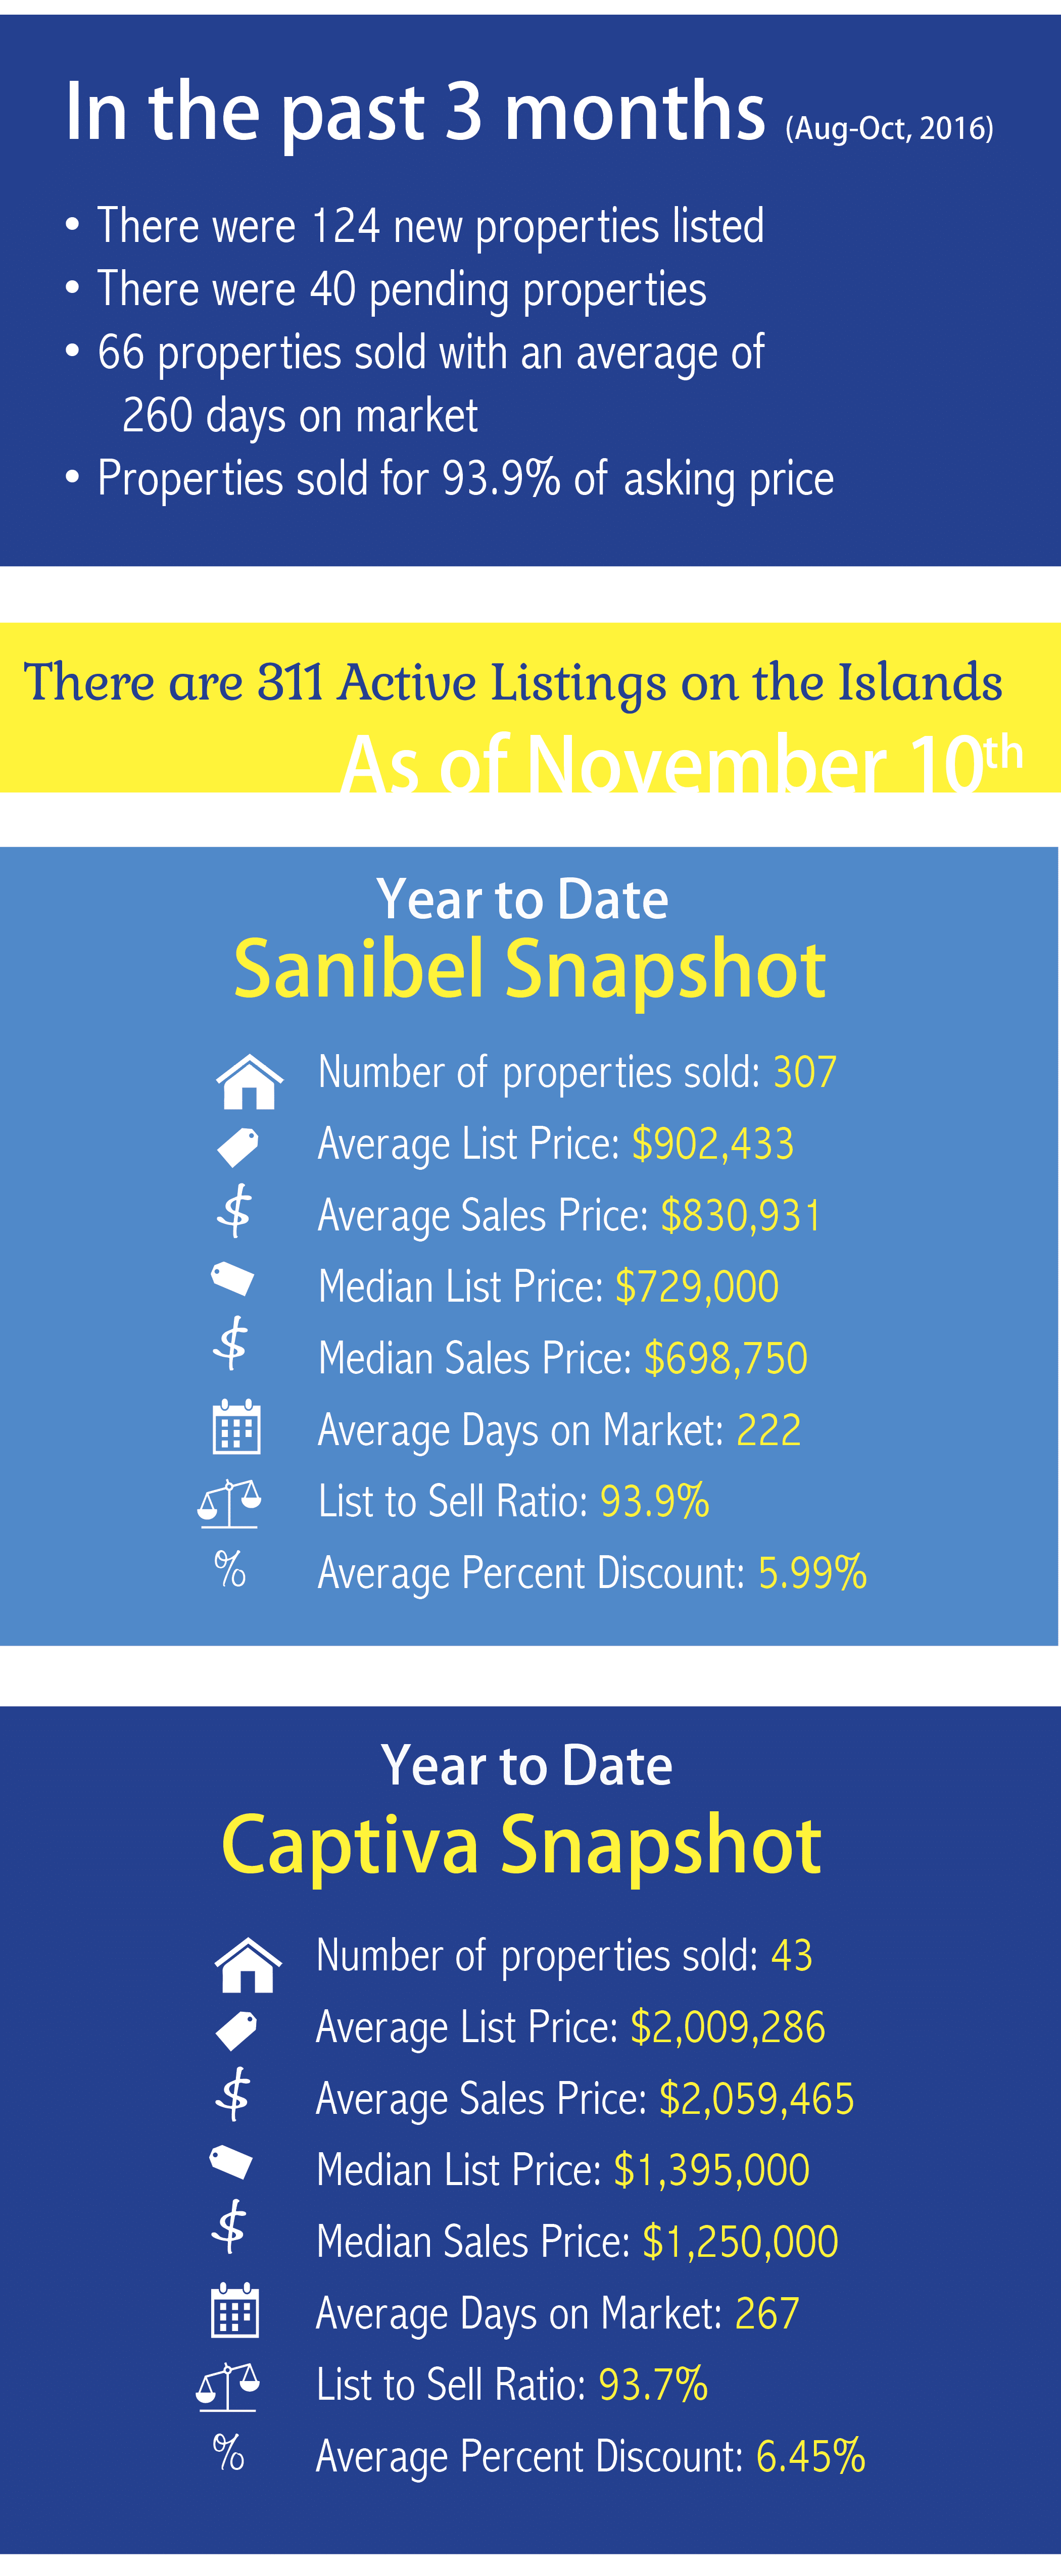
Below I’ve listed more statistics from the past three months. These represent the number of new residential homes and condos that have come on the market on Sanibel and Captiva, as well as the number of homes that went pending and sold during August, September and October of 2016. The days on market is an average taken from of the three months of sales, and the sales to list price ratio is an average of the sales and listing price of residential homes and condos that sold during the same theres month timeframe.

infographic-marketupdate-fall2016
[/thrive_lead_lock]

Primary Sidebar

Recent Sanibel Real Estate News

Sanibel Population Per Mile of Beach Chart

Like Crowded Beaches? Don’t Come to Sanibel.…

Protected Nature = Protected Home Owner…

Heat Pump Installation: How It Affects Your Home’s Plumbing…

Florida Home Inventory Increases Significantly…

All About Coconut Palms…

424 E Gulf Drive

Sanibel Single Family Home Rental Restrictions…

New Captiva and Sanibel Real Estate Listings

View recent Captiva and Sanibel listings...

Sanibel Real Estate Listings

Sanibel Homes for sale

  • All Sanibel Homes for Sale
  • Sanibel Beachfront homes
  • Sanibel Bayfront homes
  • Sanibel Gulf Access homes
  • Sanibel Water View homes
  • Sanibel Elevated homes
  • Sanibel Golf Community homes

Sanibel Homes by Price

  • under $1,000,000
  • $1,000,000 - $1,500,000
  • $1,500,000 - $2,000,000
  • $2,000,000 - $3,000,000
  • $3,000,000 and up

Sanibel Condos for sale

  • --> See our full Sanibel Condo Guide
  • Sanibel Beachfront condos
  • Sanibel Bayfront condos
  • Sanibel Pet Friendly condos
  • Sanibel Boat Dock condos
  • Sanibel Condo Directory

Captiva Homes for Sale

  • Captiva Beachfront homes
  • Captiva Bayfront homes
  • Captiva Gulf Front condos
  • Captiva Bay View condos
  • under $4,000,000
  • $4,000,000 and up

Explore more

McCallion & McCallion Realty Logo

McCallion & McCallion Realty
1640 Periwinkle Way, Suite 1
Sanibel Island, Florida 33957
(239) 472-1950

  • email us
  • facebook
  • instagram
  • pinterest
McCallion & McCallion Realty Logo
(239) 472-1950 email us facebook instagram pinterest
Copyright © · Susan McCallion · Broker · McCallion & McCallion · Sanibel Real Estate · Listings · Sitemap