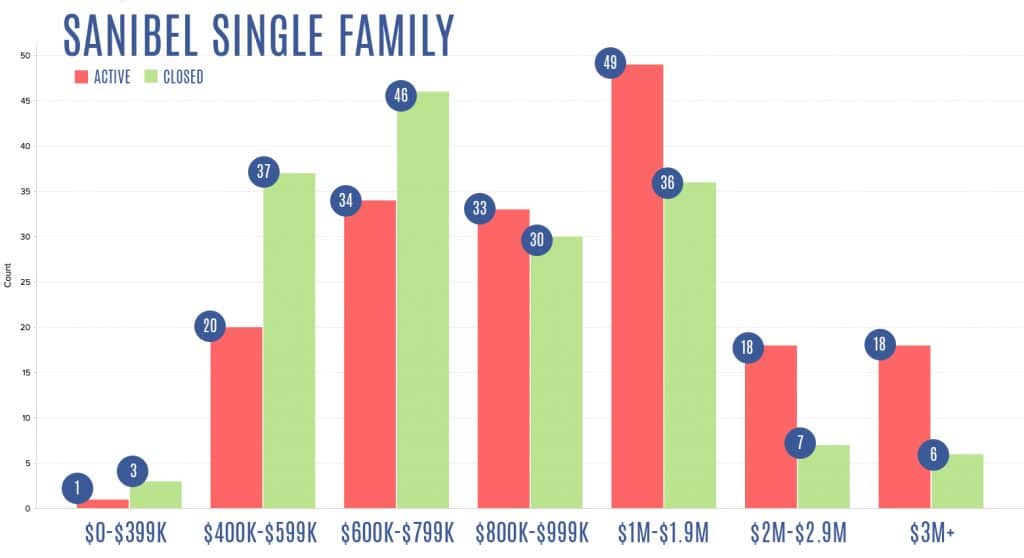
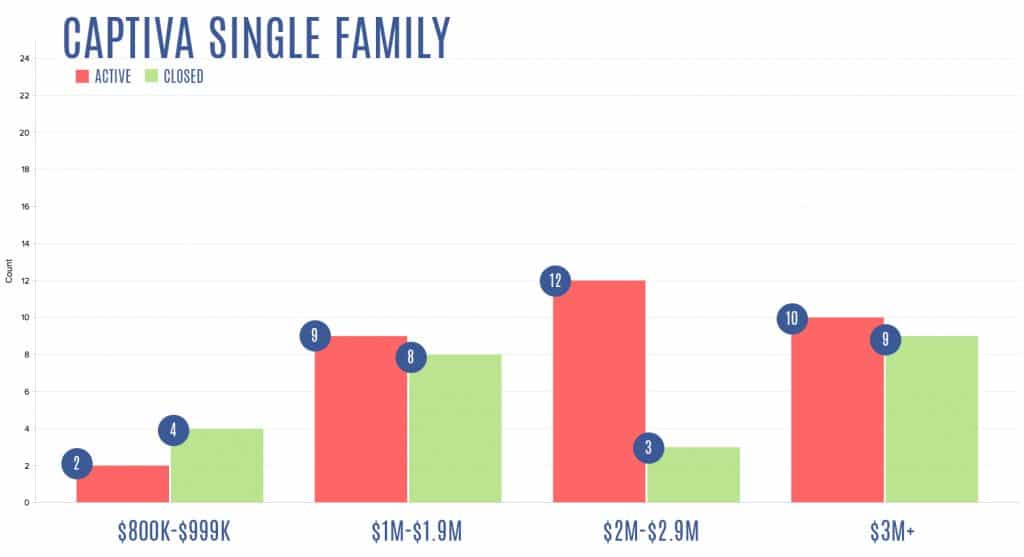
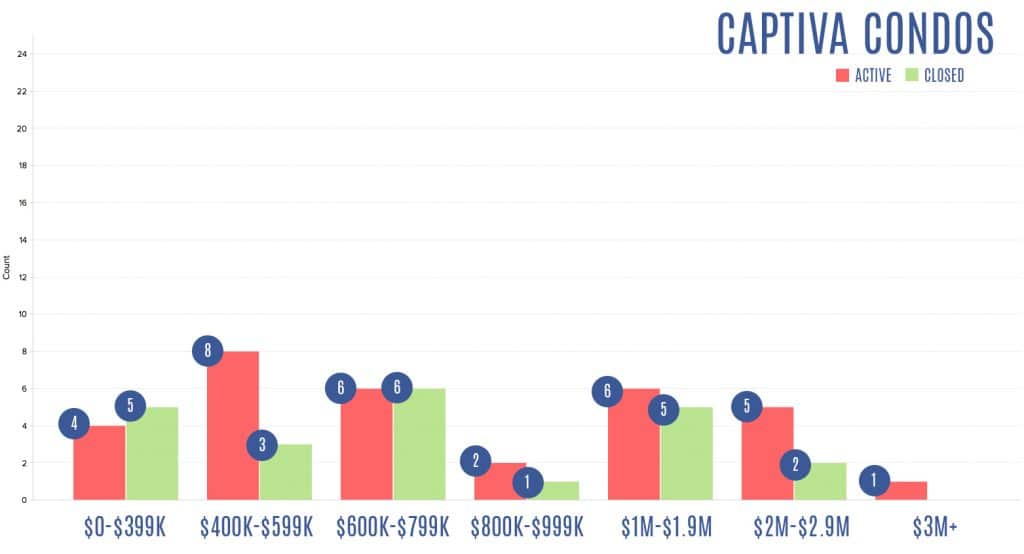
At the year’s end we like to go back and look at what sold in each price range here on the island. Breaking down the year’s home sales by price-range gives us a good overview of the market. The graphs below show the number of closed sales that took place in each price range last year, along with the number of currently active listing in each price range.
To take it a step further, we’ve broken out the differences between island location and property type. As you can see, the differences between Sanibel and Captiva and Single Family Homes vs. Condos greatly changes the outlook of each graph.


