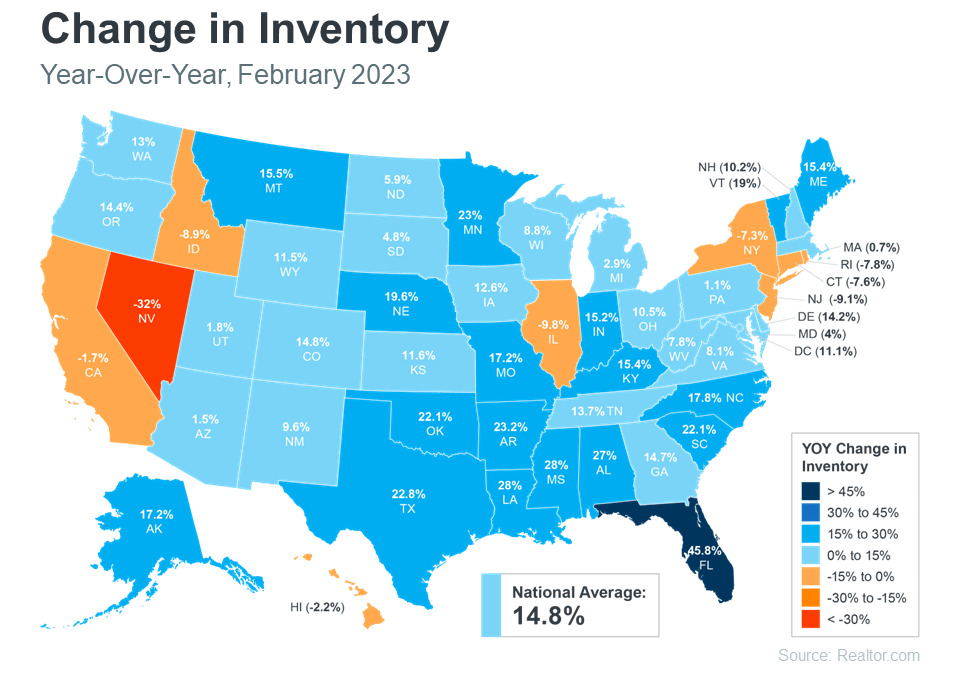
One of these things is not like the other…

The above graphic shows the increase in home inventory for each state, comparing Realtor.com data from February 2024 with February 2023. It is evident that Florida had the largest increase in home inventory during that time, but note the other blue-colored states that show an increase in inventory as well. In fact, there was a national average increase of 14.8%.
What About Southwest Florida?
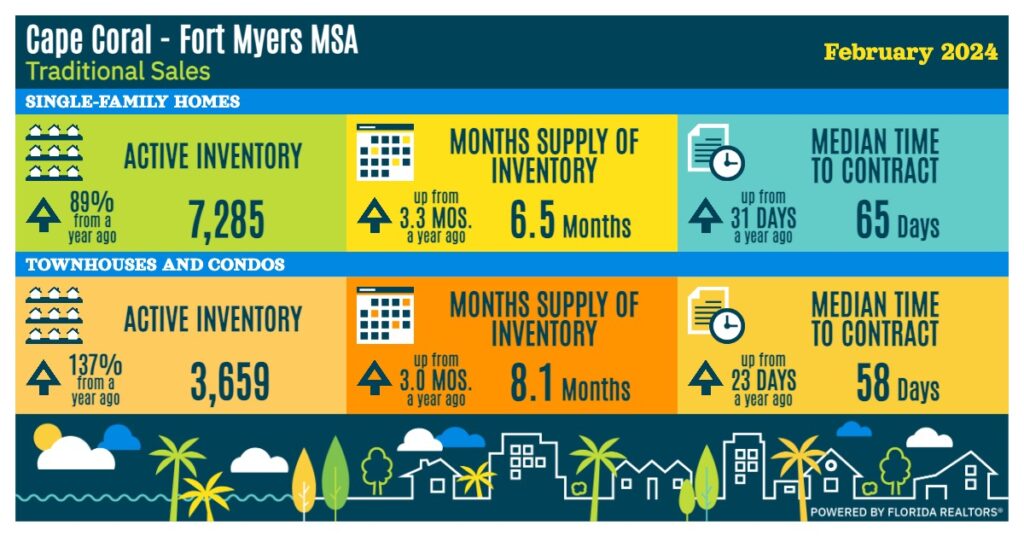
Great question! We used the Florida Realtor Association SunStats tool to generate the graphic below. To keep the data consistent with the national graphic above, we compared stats from February 2024 with February 2023.

The above graphic includes the entire Cape Coral-Fort Myers MSA listed by The Florida Realtor Association, which spans Lee County. The graphic is divided top to bottom by Single Family Homes vs. Condos/Townhomes. The stats show an even greater increase in inventory than the national graphic from Relator.com.
What About Sanibel Island?
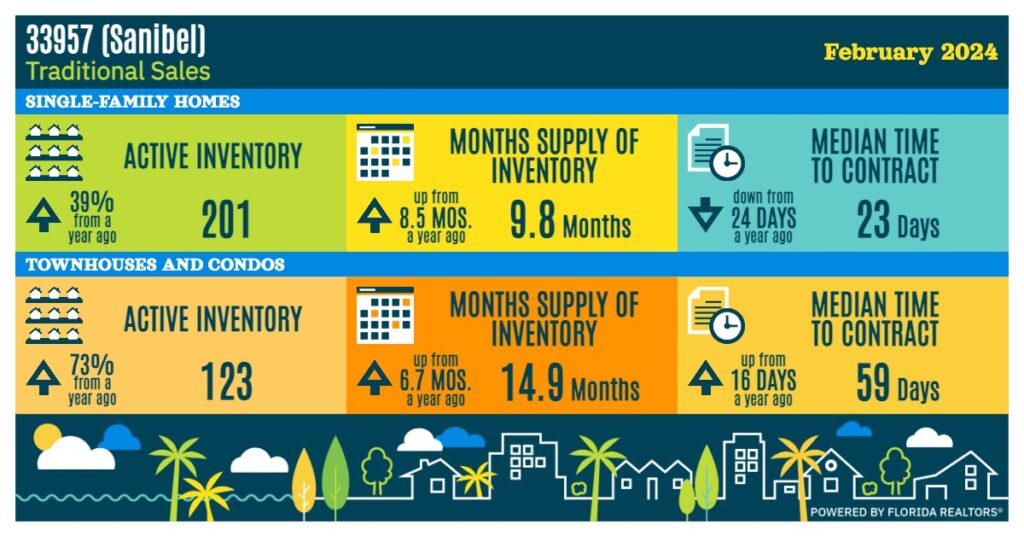
Another great question. We used the same Florida Realtor SunStats tool to pull the graphic below which, again, compares data from February 2024 to February 2023.

It’s important to note that February 2023 was just 5 months after Hurricane Ian devastated the area. So, as you can imagine, that had a big impact on our real estate market statistics. Still, you can see an increase in inventory over year over year.
Like any stat comparison, there are many factors that can swing data one way or another. The intention of this blog is to show a general increase in home inventory seen at a national, state, regional, and local level.
As always, if you have questions about specific areas, property types, and buying situations, we’re happy to dive deeper into comparisons for you. Please don’t hesitate to reach out via email at team@mccallionrealty.com or call us at 239-472-1950.
