As we enter a new year, it’s interesting to look back at 2015’s final quarter statistics to get an overview of how our market has changed. The information below is based on data from the Sanibel and Captiva MLS as of December 31, 2015.
So what happened during the Holiday season?
In the past three months, a total of 31 single family homes and 31 condos were sold on Sanibel and Captiva Islands. All together, 235 single family homes and 187 condos sold last year, bringing us to a grand total of 422 homes sold on Sanibel and Captiva Islands in 2015. Compared to 2014, this is a 3.2% increase in the total number of homes sold on the islands.
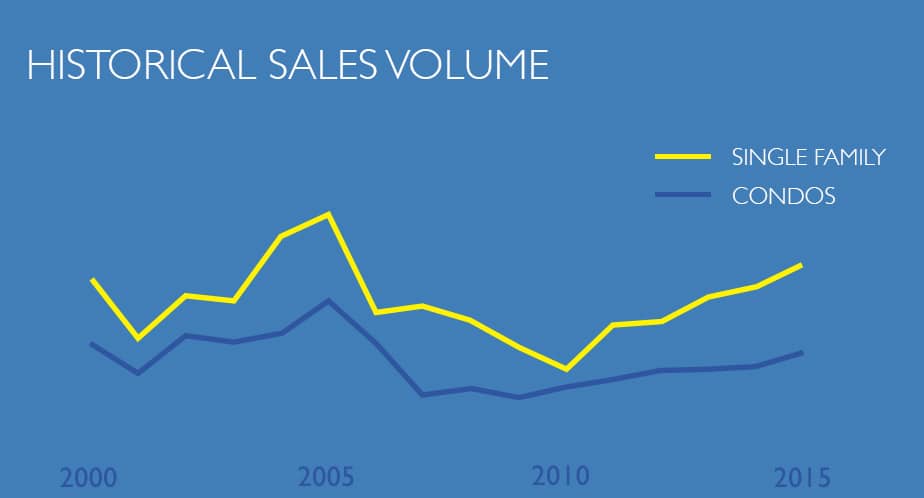
If you follow the real estate market, you’ve probably heard that home values are on the rise nationwide. It’s true for Southwest Florida too, in fact, between 2014 and 2015 Sanibel and Captiva Islands saw a 15.1% increase in total sales volume. As you see below, both condos and single family homes have seen a steady increase in sales volume over the past 6 years. Single family homes especially, have seen a steep increase, which is climbing closer to where we were at the height of the market back in 2005.
The increase in total sales volume can be largely attributed to the increase in home values over the year. Our 2015 4th quarter stats show an increase in the average sale price of both single family homes and condos compared to Q4 of 2014. To give you an idea of what homes sold for this quarter, in October, the average sales price for single family homes was $845K and $913K for condos. In November, the average sales price rose to $1.3M for single family homes and $940K for condos. December closed with the average sales price of single family homes at $1.2M and $651K for condos.
All together, there was a 19.4% increase in the average sales price of single family homes from Q4 2014 to Q4 2015, and a 42.3% increase in the average sales price of condos in the same time frame.
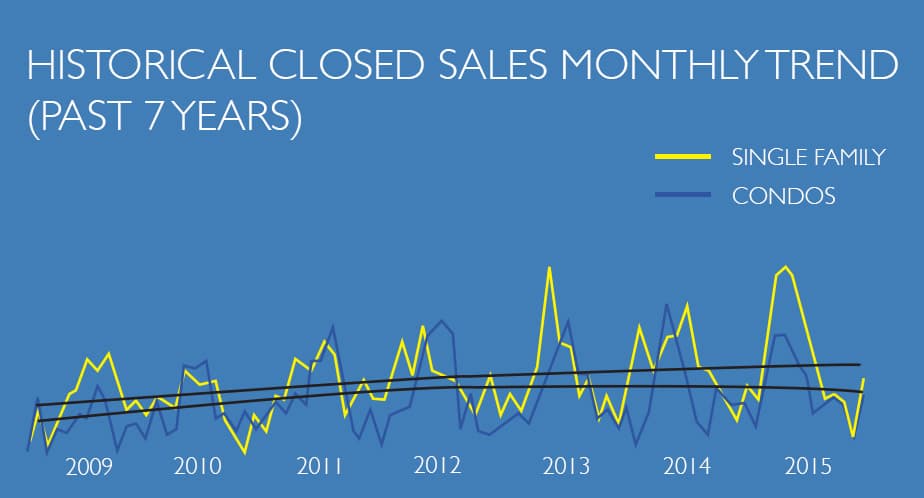
Just like the weather, the market here is seasonal. As you can see, our late winter through spring months are the heaviest in terms of the number of sales per month. This seasonality of sales is not a recent development in the market. In fact, if you take a look at the historical closed sales monthly trend below, you’ll see that the past 7 years shows this same rise and fall in number of sales throughout the year.
What else is new?
The average days on market has decreased nearly 6% since 2014. Homes are not only selling for more money, but they are also selling faster than previous years.
We can also see that homes are selling close to asking price. The list to sell price ratio for year’s end 2015 was 93.5%, which is higher than the 93.3% ratio achieved in Q3 2015.
Now, on to the good stuff…
Below is a breakdown of our inventory for Sanibel single family homes and condos. The charts show the number of active listings by price range, as well as the number of months inventory for that price range. As a rule of thumb, nine months inventory and higher usually reflects a buyer’s market, six to nine months of inventory is a balanced market, and five months or less is considered a seller’s market. When there are more homes for sale at a certain price range, there are more “months inventory” for the price range, therefore, the buyer’s tend to have the upper hand in the selection and negotiation process.
As you can see from the charts, there are fewer homes available in the lower price ranges. For single family homes on Sanibel, anything priced under $800k is considered a strong seller’s market with less than five months inventory. The number of active condos has increased in the 4th quarter, which is the usual time we see homes come on the market – right before “peak season.”
I hope this helps you better understand what’s happened in the past few months, and where the market is headed into 2016. If you have any questions, or would like to talk about the best time for you to buy or sell your home, please don’t hesitate to call or email me today! I’m happy to help in anyway.
Beach Smiles,
Susan


