After each quarter, we like to review how the real estate market here on Sanibel and Captiva Islands is performing. One of the most revealing data points, in my opinion, is the inventory of homes currently for sale. We often describe inventory in terms of “months,” but you might also see it referred to as “months supply,” or it’s inverse, “absorption rate.”

How Do We Measure Inventory?
Good question. The months of inventory is derived from an extremely complicated mathematical equation: Number of Active Homes / Average Number of Closed Sales per month… Yes, it’s just that simple. Don’t worry, to save you the stress and hair pulling, we’ve done the math for you!
Sanibel’s Current Home Inventory
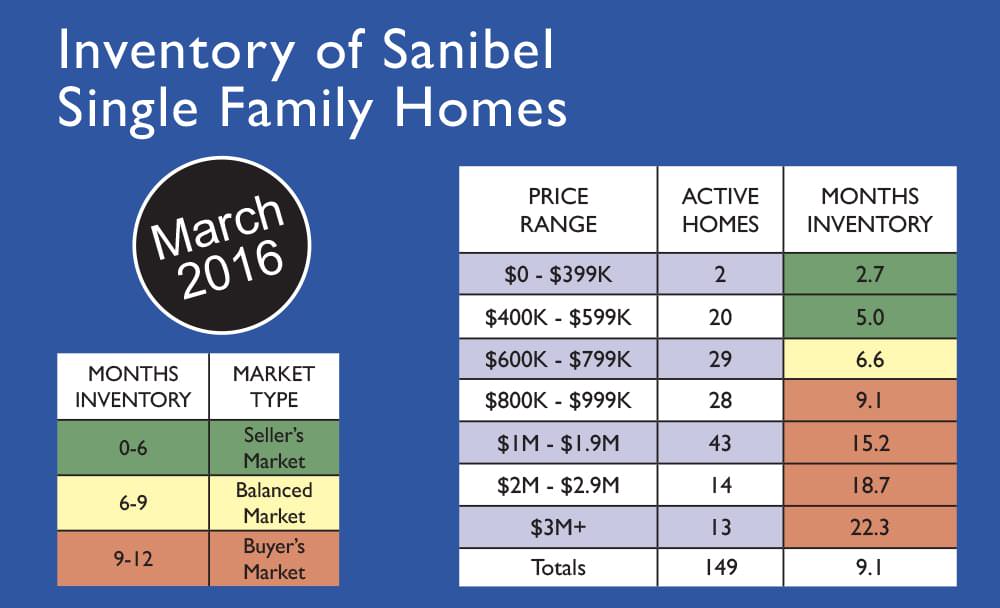
This is what our current month’s inventory for Sanibel Single Family Homes shows as of the end of March 2016.
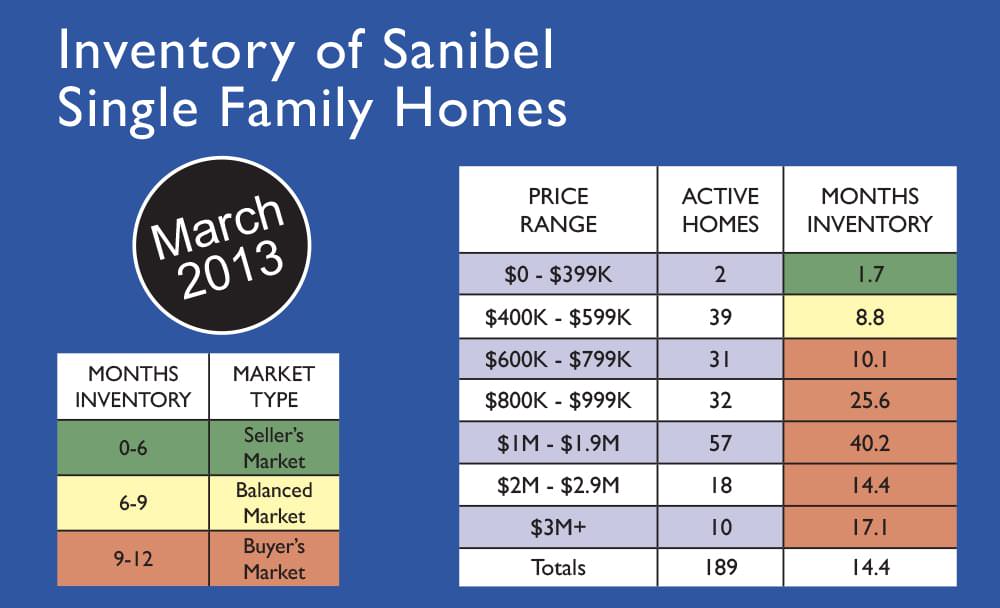
Compared to three years ago, we see there’s been a decrease in inventory across the board. A couple of key points:
- Under $600k the number of active listings has dropped by half
- In the $800k to $2M price range, homes are selling much faster as reflected by a dramatic drop in the Months of inventory
Keep in mind these numbers fluctuate month to month, especially in a seasonal marketplace like Sanibel and Captiva Islands.
Seller vs. Buyer Markets
As the the months of inventory drops, Sellers have relatively more negotiating power. Based on this, we classify different price points as a “Buyers Market”, “Balanced Market” or “Sellers Market”. Many real estate professionals consider inventory under 6 months as a “Sellers Market,” where there are less options for buyers and less competition for sellers. In these situations of low inventory, home owner’s have the upper hand in negotiations, where there could be multiple offers coming in on the property at once.
Between 6-9 months of inventory in a price range is considered a “Balanced Market,” where neither side of the transaction is “favored” by the market conditions. However, anything over 9 months is usually a “Buyers Market,” where buyers have more options to choose from, and might also have the upper hand in negotiations, depending on the Seller’s motivations.
As you can see, from the charts above, the price ranges of single family homes on Sanibel that are considered a “Seller’s Market” have increased over the years from anything under $399k, to anything under $599k. Now, homes between $600k-$799k are in a “Balanced Market,” and single family homes above $800k are considered a “Buyer’s Market.”
Numbers Nerds Unite
If you’re a numbers nerd like myself, you can see how in just 3 years our market has appreciated significantly. Inventory has decreased in almost all price ranges, and we’re starting to see higher price points become “Seller’s Markets” with higher competition for buyers in that price range.
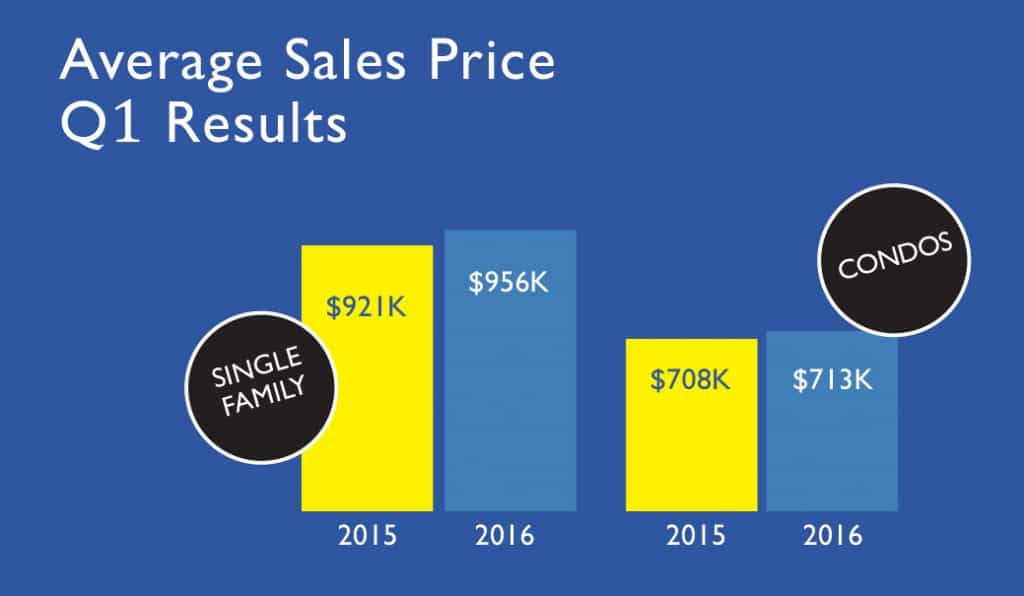
In the graph below, you can see prices are also continuing to increase for both single family homes and condos on Sanibel. Where the average sales price for single family homes was $921k in Q1 2015, the average sales price was $956k in Q1 this year. Sanibel condos experienced a slight increase in average sales price as well, going from an average price of $708k in Q1 2015 to $713k at the end of Q1 2016.
What Does this Mean for You?
The market has been appreciating and inventory levels have decreased. Your “Best Deal” may be one you make now versus waiting until next season. We encourage you not to just wait for “your great bargain,” but make your bargain happen! Our clients that bought last year all feel they “got a bargain.” Talk to us about your plans, what you are looking for, and in what price range… we’re happy to help your buying process in any way!
If you’d like to see more statistics from the end of Q1 2016, or for a particular property type, don’t hesitate to call or email me at 239-472-1950 or jim@mccallionrealty.com.


