Happy New Year! For those who enjoy year-end statistics as much as I do, here’s a snapshot of real estate market stats for Sanibel and Captiva Islands using data from our San-Cap MLS.
10% Increase in Homes Sold
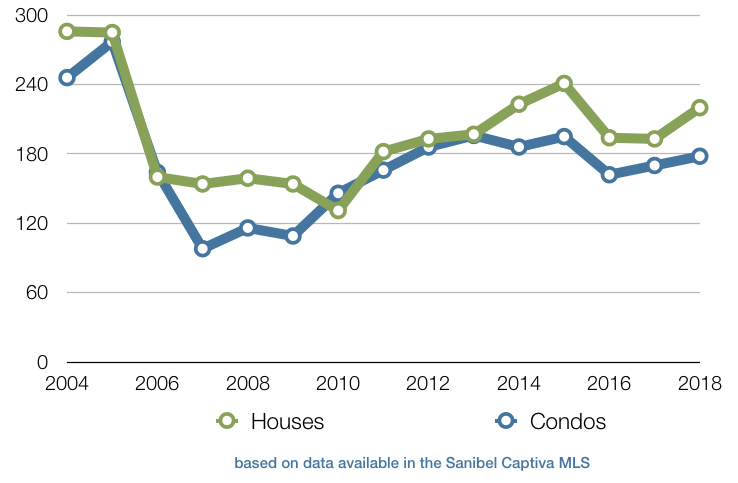
The number of homes sold on island in 2018 increased by 10% from that sold in 2017. There were a total of 220 single family homes and 178 condos sold on Sanibel and Captiva Islands this year. That compares to the 193 single family homes and 170 condos sold on Sanibel and Captiva in 2017. If you’re wondering what prior years look like, the chart below shows the year-over-year change in the number of properties sold on island for the past 15 years.
Number of Homes Sold on Sanibel & Captiva
16% Increase in Sales Volume
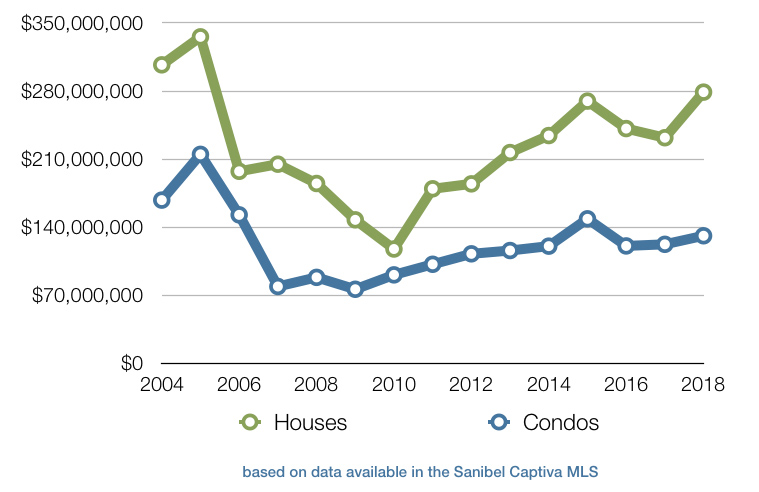
A 10% increase in the number of sales is great. We saw an even higher percentage increase in the total dollar volume of property sold on island as well… a 16% increase to be exact. The San-Cap MLS recorded an increase of $55M between the dollar volume of homes sold in 2017 vs. 2018. Take a look at the graph below to see the year-over-year change in sales volume for the past 15 years.
Dollar Volume of Sales on Sanibel & Captiva
Year End Stats By Island Property Type
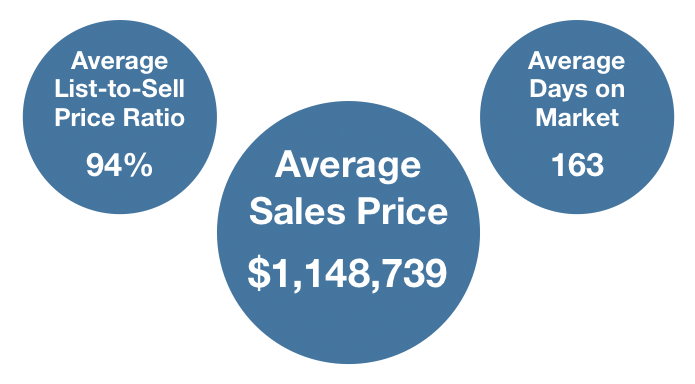
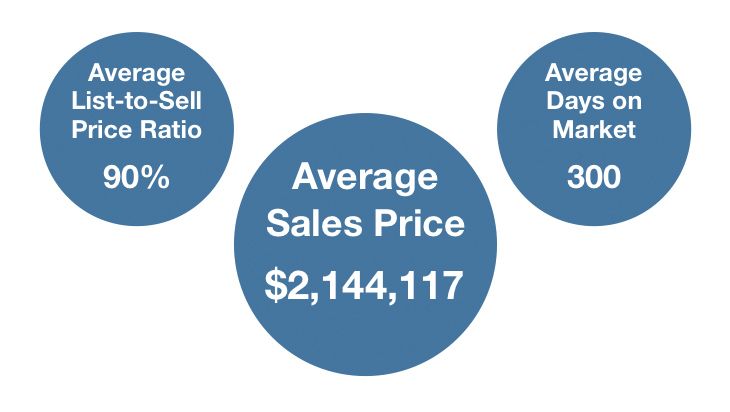
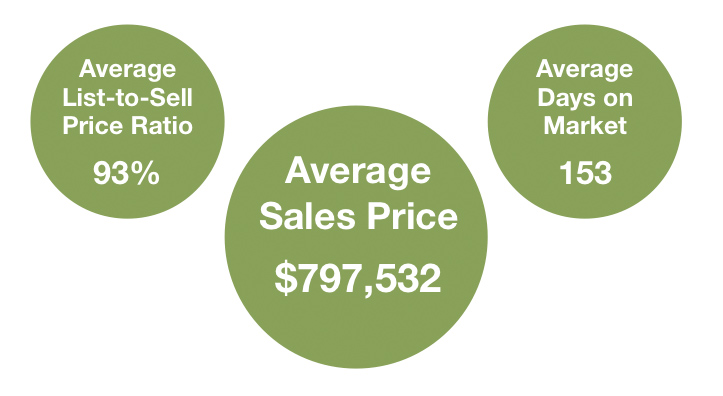
Below, we list the average sales price of homes sold in 2018, along with the average sale to list price ratio, and the average days on market. The data was taken from the Sanibel-Captiva MLS on Jan 2, 2019.
Sanibel Single Family Homes
Sanibel Condos
Captiva Single Family Homes
Captiva Condos

