It’s May already?? This time of year is always bittersweet to see so many of our seasonal friends return to their Summer homes up north or out west. While traffic on the island has improved significantly, our office is still buzzing with clients who are under contract or still searching for their island home.
What’s for sale right now?
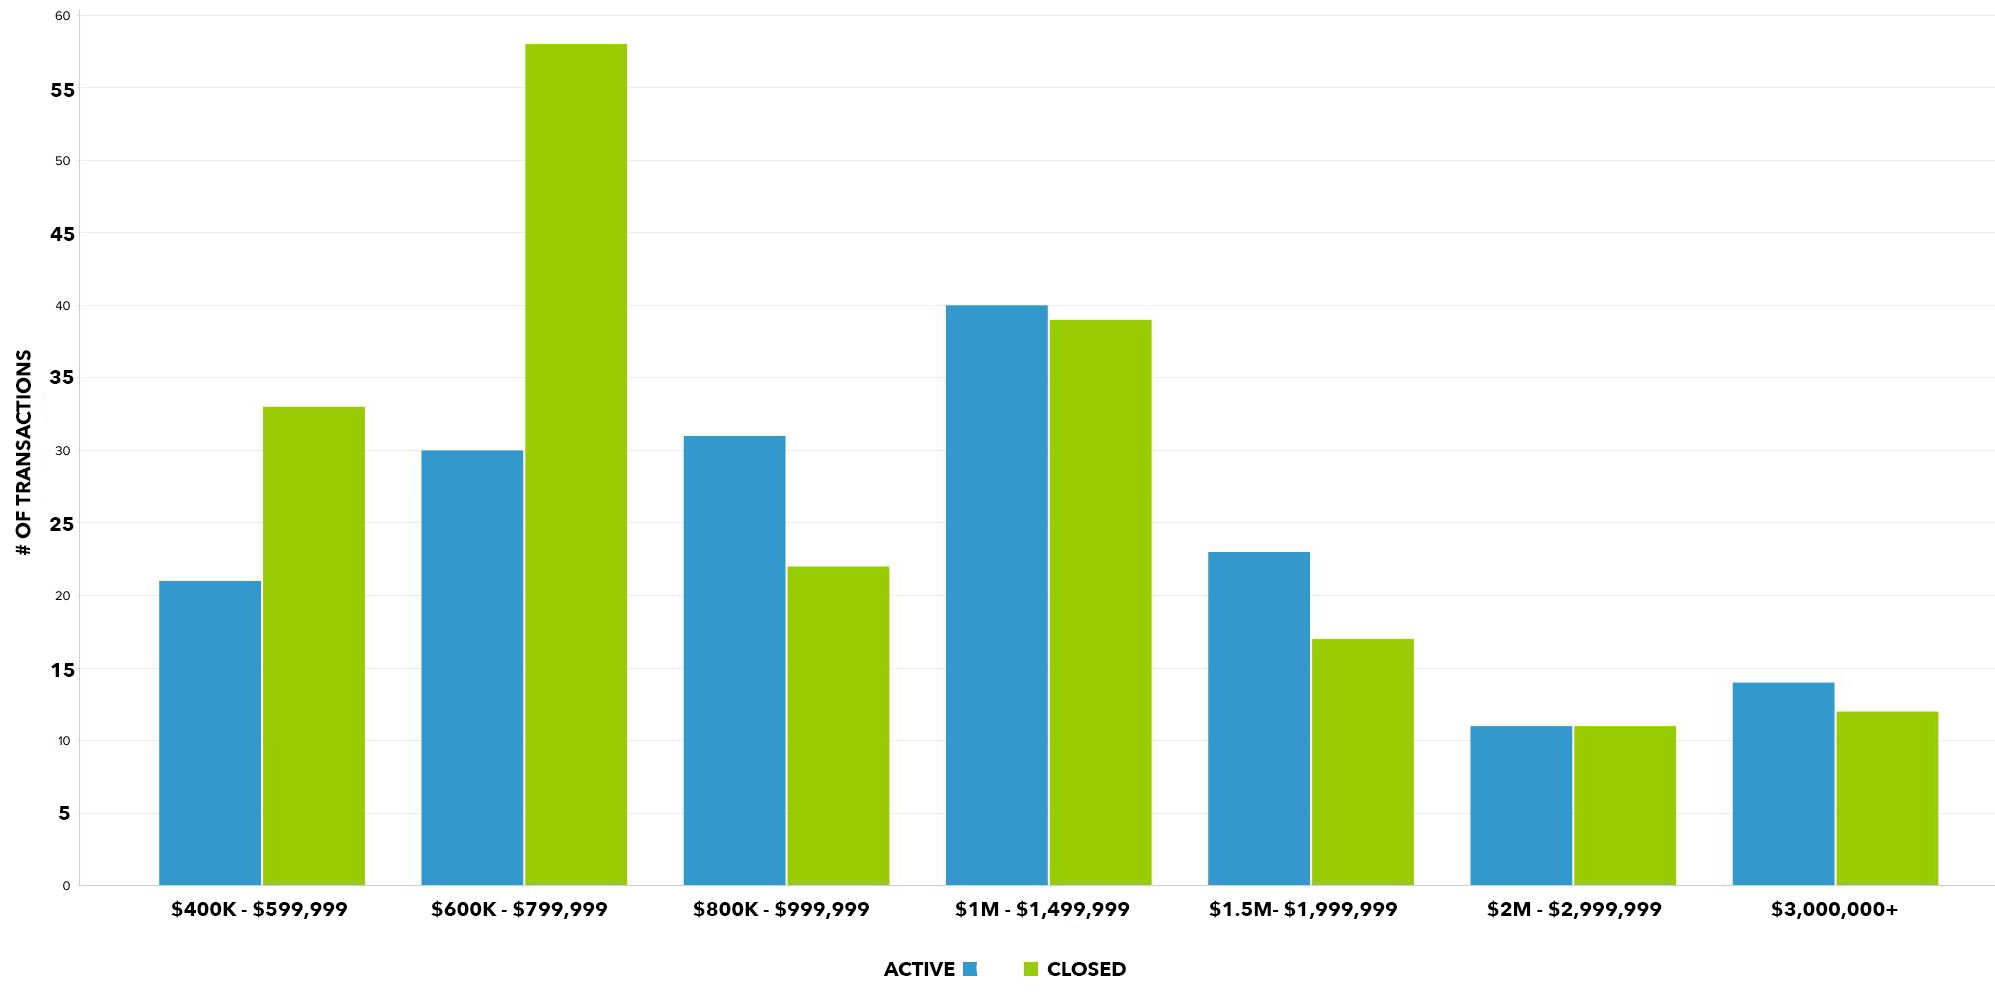
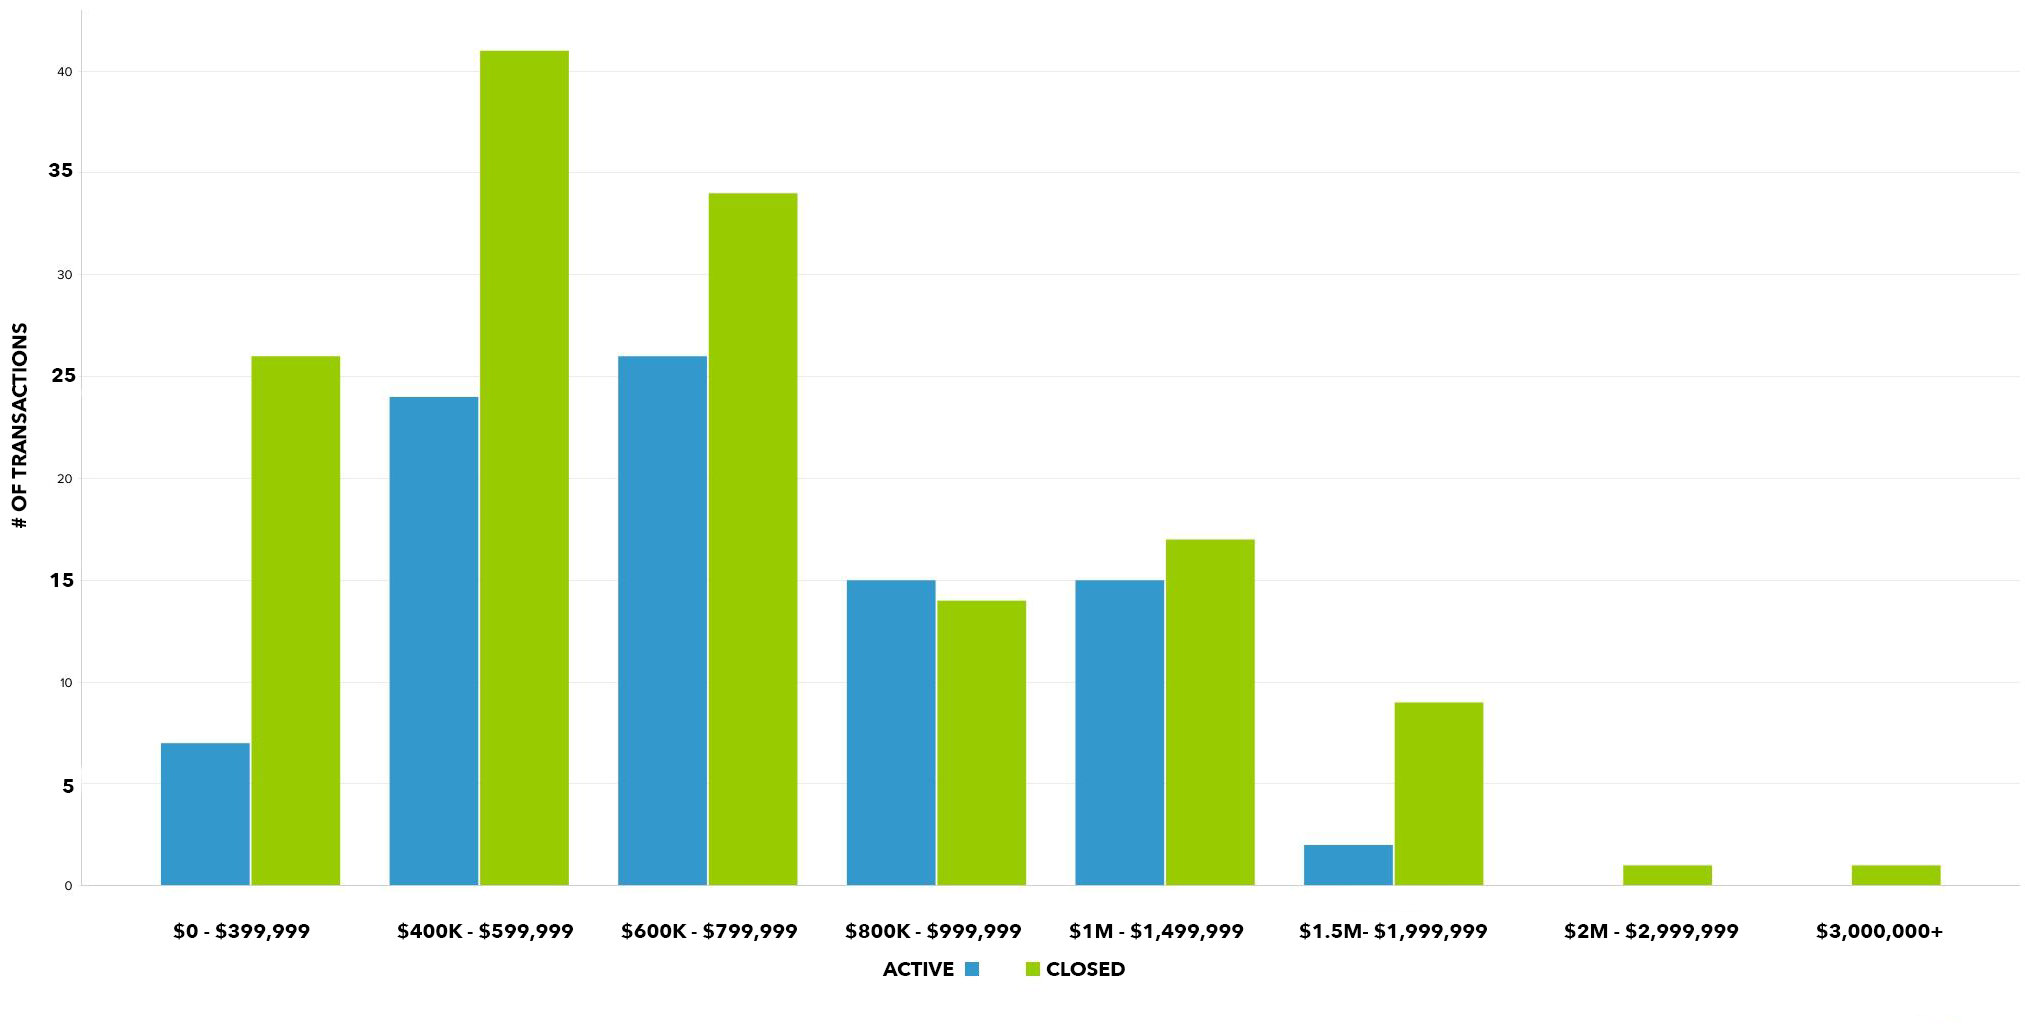
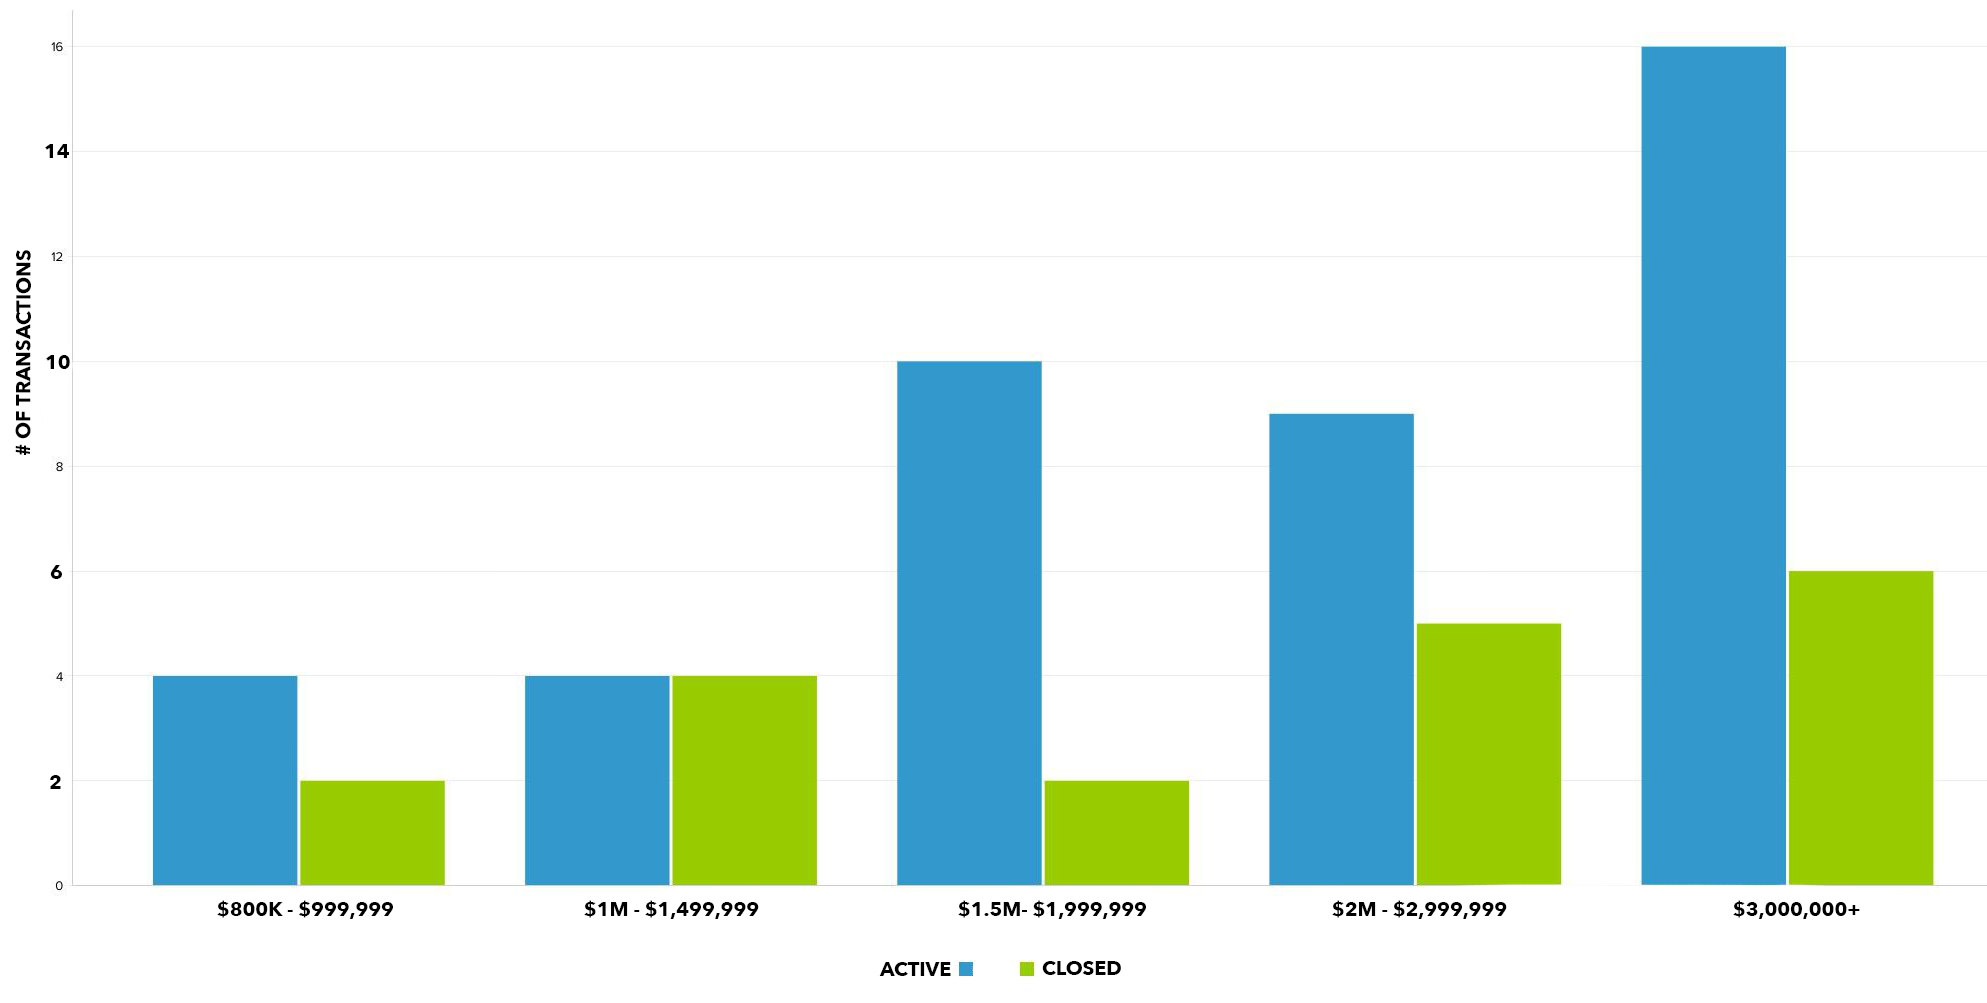
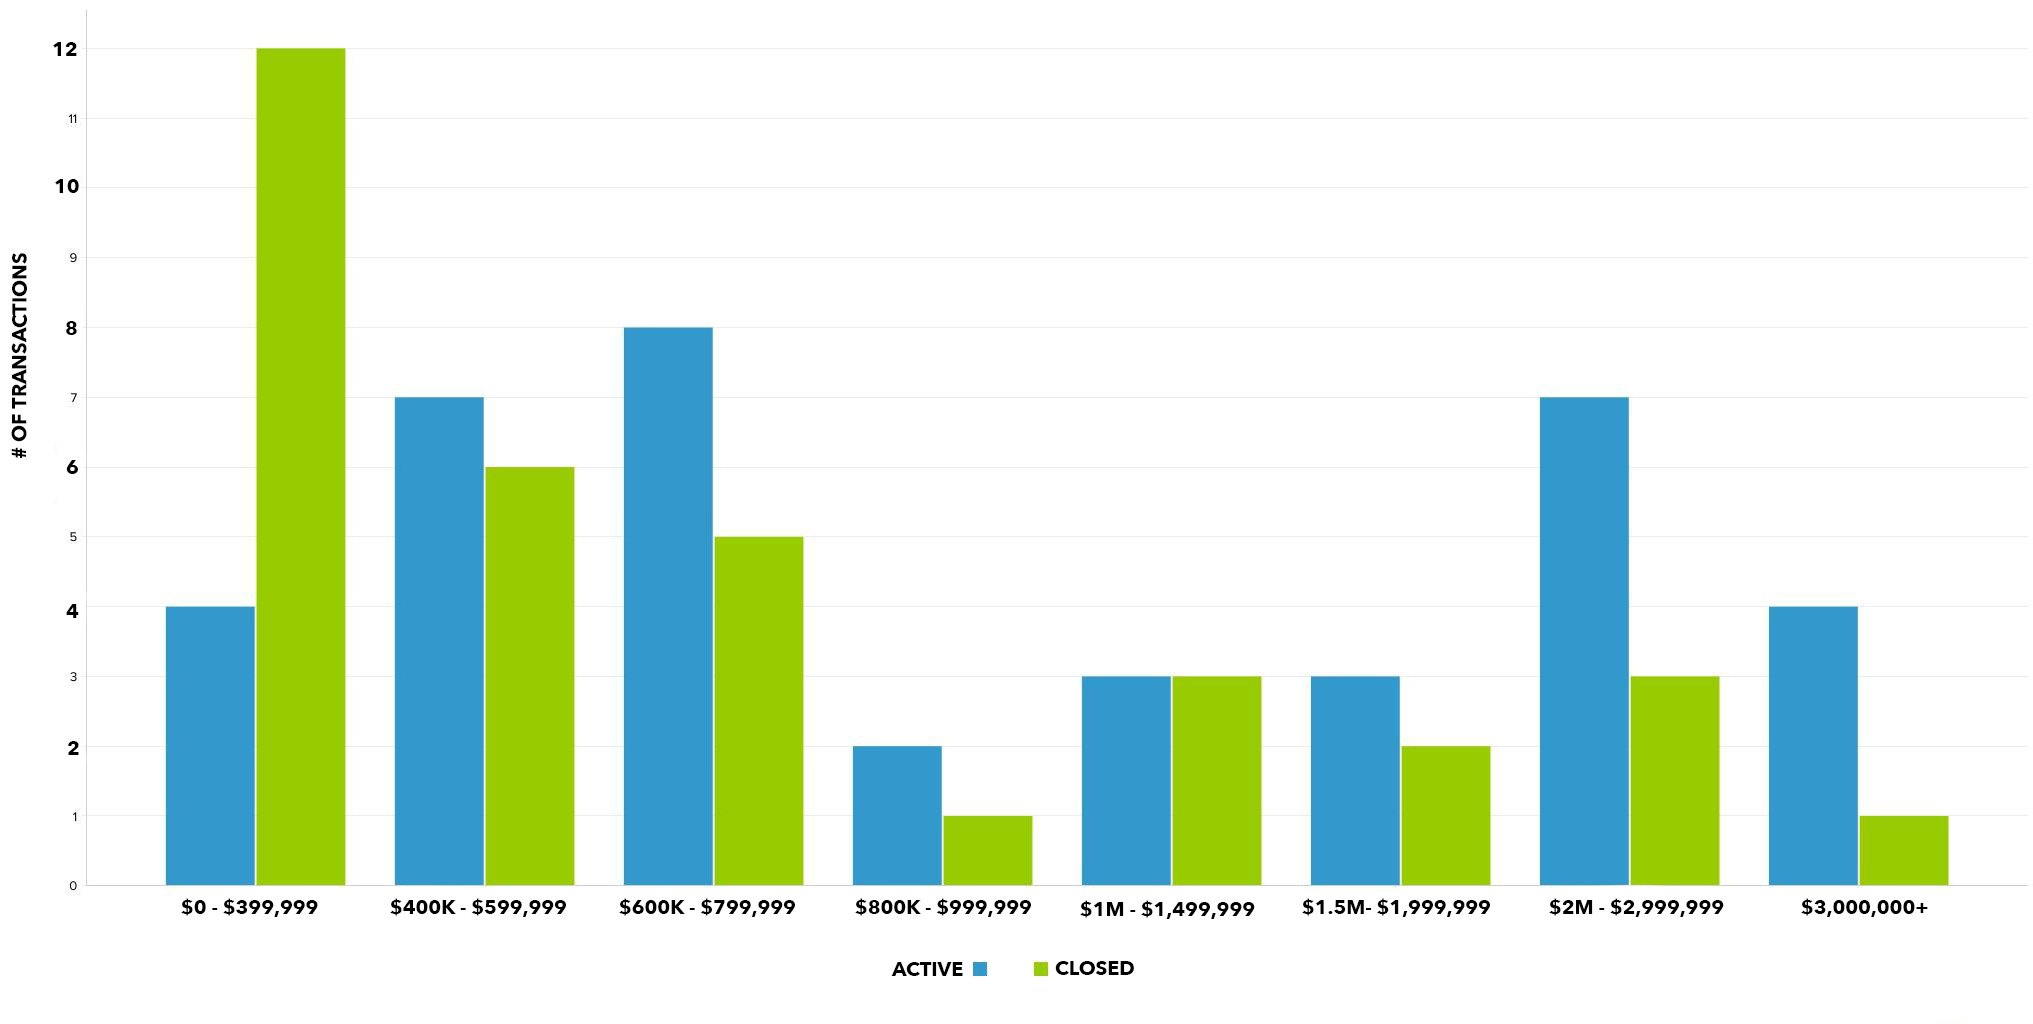
Below, you’ll find graphs for Sanibel and Captiva that highlight the number of homes currently for sale in each price range, along with the number of homes that have sold in each price range over the past 12 months. The blue bar represents the number of homes that were listed as “for sale” as of May 3, 2018. The green bar shows the number of homes that have sold in each price point over the past 12 months.
We’ve broken it down by Sanibel Single Family Homes, Sanibel Condos, Captiva Single Family Homes, and Captiva Condos, since each category has very different statistics. Take a look below! (Note, graphs my take a second to fully load).
Sanibel Single Family Homes
Comparison of prior 12-month closed sales to listings “active” as of May 3, 2018. Click to enlarge graph.
Click each price range below to see all Sanibel Single Family Homes listed for sale:
Sanibel Condos
Comparison of prior 12-month closed sales to listings “active” as of May 3, 2018. Click to enlarge graph.
Click each price range below to see all Sanibel Condos listed for sale:
Captiva Single Family Homes
Comparison of prior 12-month closed sales to listings “active” as of May 3, 2018. Click to enlarge graph.
Click each price range below to see all Captiva Single Family Homes listed for sale:
Captiva Condos
Comparison of prior 12-month closed sales to listings “active” as of May 3, 2018. Click to enlarge graph.
Click each price range below to see all Captiva Condos listed for sale:

