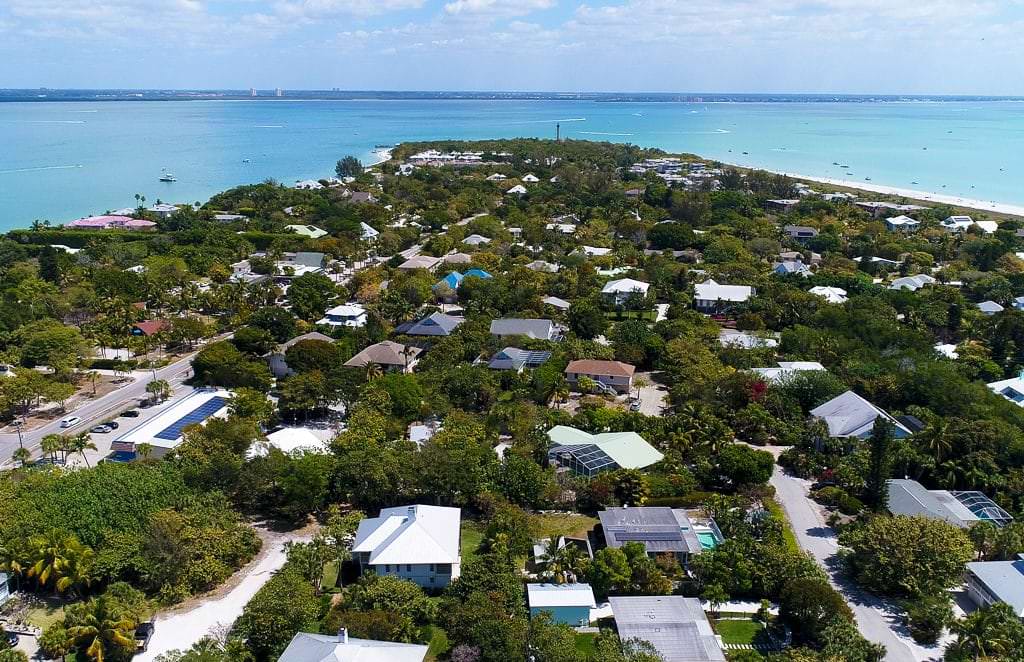
This week alone I have met with nine different clients, some looking to buy a home here on the islands, some looking to sell their Sanibel home, and others who just closed on their island home! I’d say its been a pretty good week! And, I expect it will be this busy from here until the Easter time frame when our “peak season” on Sanibel and Captiva starts to settle down.
Properties are hitting the market fast, and some are going under contract in less than 24-hours (true story from this week!). So if you are keeping an eye on the market, here’s a report of how many homes we currently have for sale in each price range (knowing some might already have changed status by the time you read this).
I like this report because it also shows how many homes have sold in each price range over the past 12 months. This information can help you better understand the inventory level of homes in each price range, which, in turn might help you determine the urgency of your timeframe to buy.
Take a peek at the graphs below which show the number of homes currently for sale as of January 11, 2018 (blue bar), and the number of homes that have sold in each price point over the past 12 months (green bar). Note, graphs may take a second to fully load.
Sanibel Single Family Homes
(Report as of January 11, 2018)
Sanibel Condos
(Report as of January 11, 2018)
Captiva Single Family Homes
(Report as of January 11, 2018)
Captiva Condos
(Report as of January 11, 2018)


