• Skip to primary navigation
  • Skip to main content
  • Skip to primary sidebar
(239) 472-1950 Login
Sanibel Real Estate Guide Logo

Sanibel Real Estate Guide

Find your Sanibel Home and Learn About Life on Our Island

  • Find Your Home
    • Real Estate Search
    • Island Condo Guide
    • Sanibel Map Search
  • Island Info
    • Island Living
    • Real Estate News
    • Sanibel & Captiva Market Report
    • Owning Vacation Rentals
    • Retiring On Sanibel
    • Sanibel New Resident Guide
  • About
    • Who We Are
  • Contact Us
  • Show Search
Hide Search
Home/Real Estate News/Market Update/Average Sales Prices of Sanibel Communities

Average Sales Prices of Sanibel Communities

There are so many great neighborhoods that make up the overall Sanibel Community. Each has it’s own characteristics and personality that makes it unique to others. It’s always fun helping potential buyers find the perfect match in a community the suits their desired lifestyle on Sanibel.

sandcastle976_web2-9

To help you understand the costs of different communities on Sanibel, we’ve created a visual representation of the average price of homes that have sold in certain communities over the past 12 months. Now, obviously this doesn’t include every community on island, but rather some of the communities where five or more properties have sold over the past year.

The map below contains the average sales price of homes based on data from June 1, 2017 – June 1, 2018. Single family communities are in royal blue, condo communities are in aqua.

Neighborhood_Sales-map

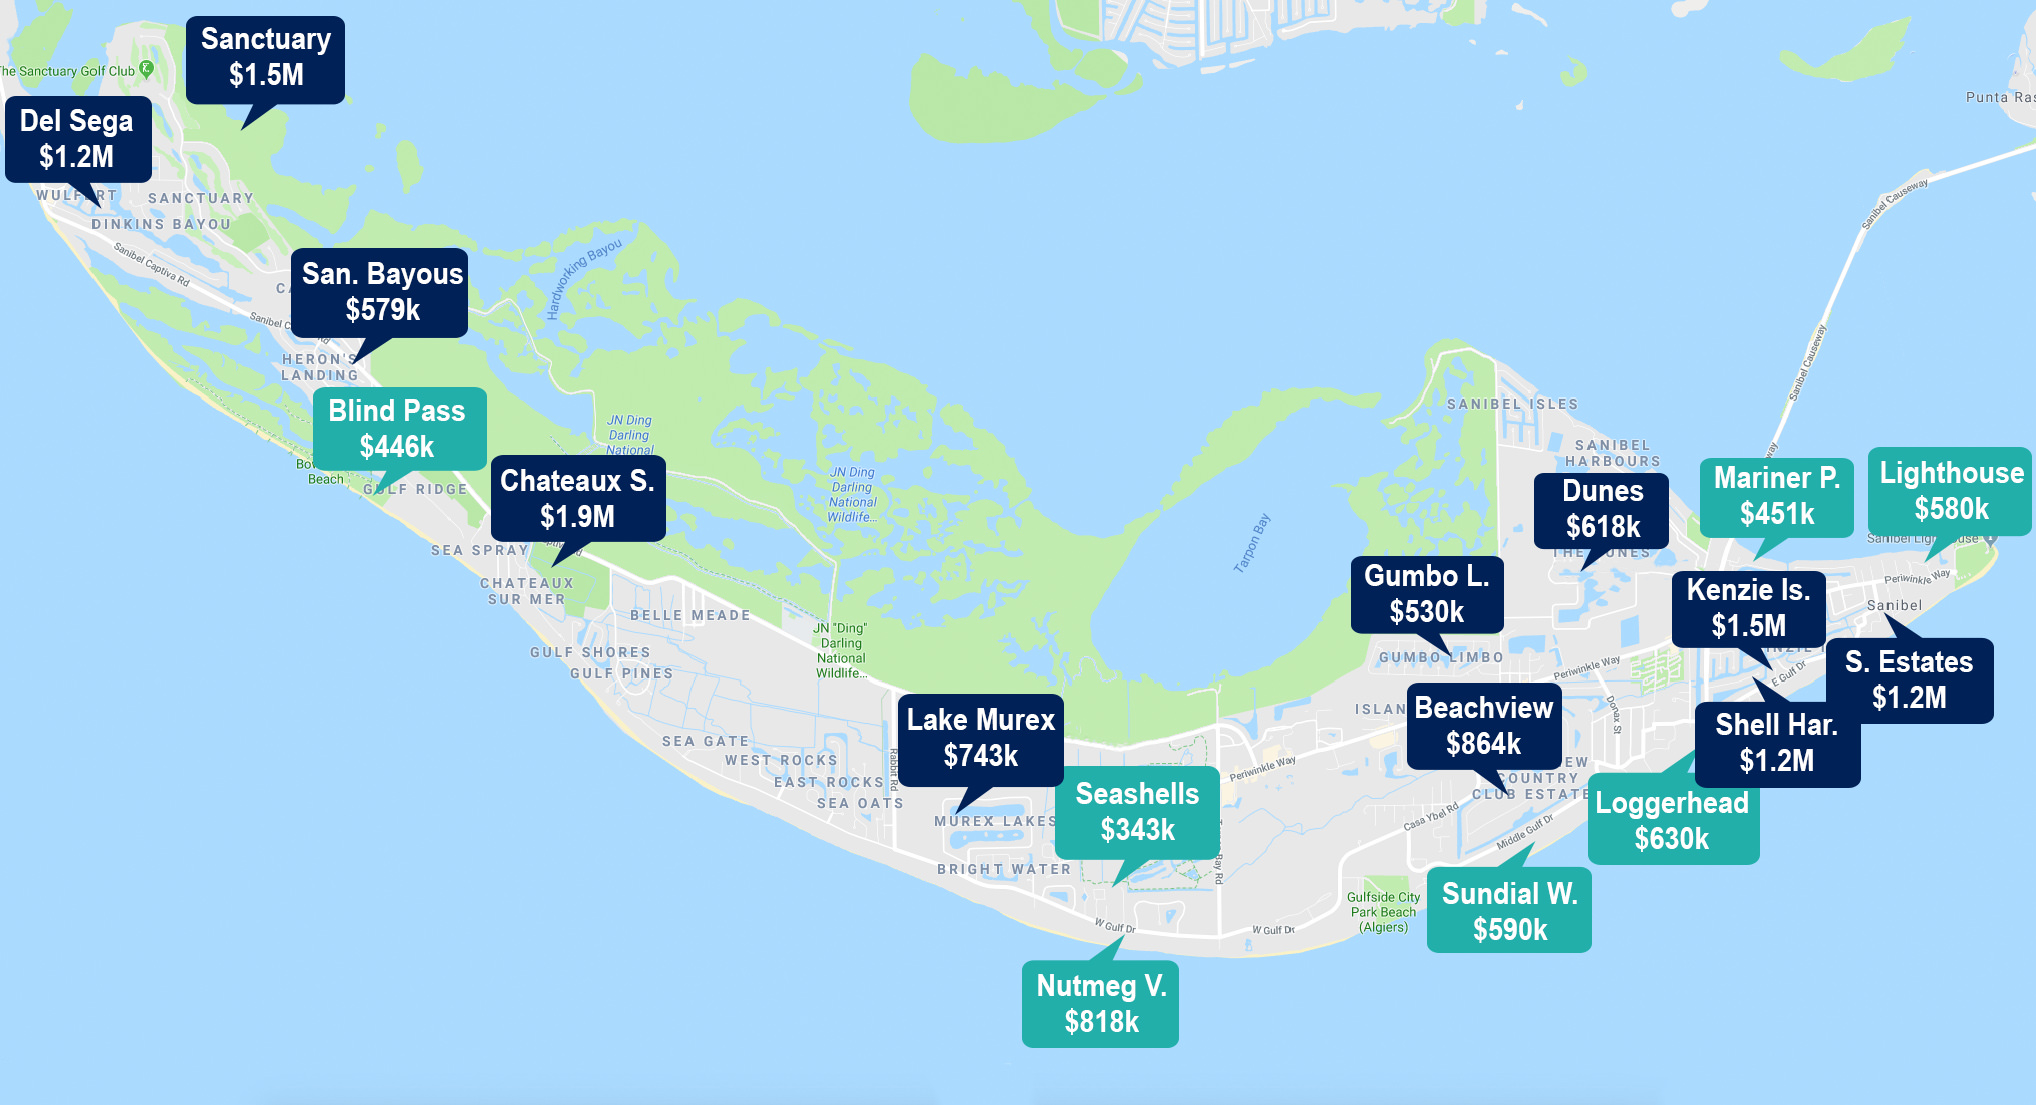
As we mentioned, this is certainly not the end all be all of Sanibel communities. There are numerous options out there, some of which only sell one or two homes a year – if any. In this case, we took those communities with a large number of homes sold, as they provide a more accurate “average” sales price spread out amongst multiple transactions.

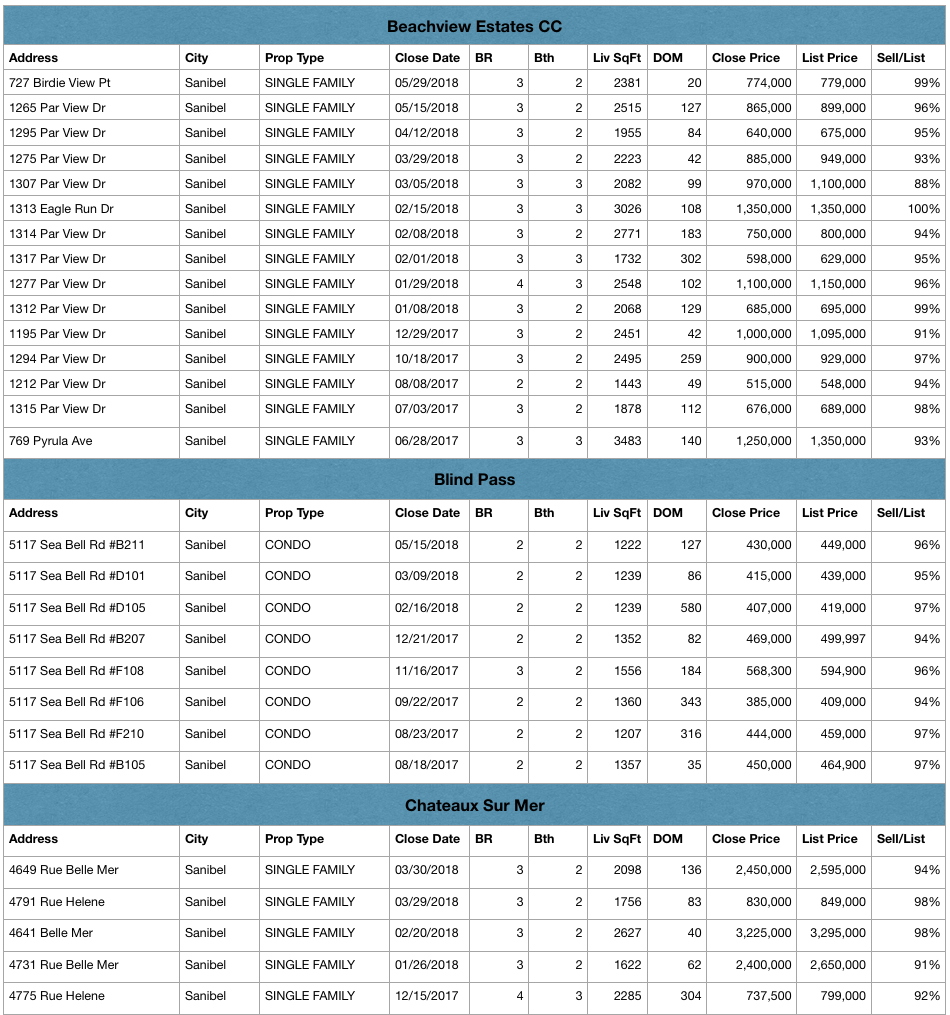
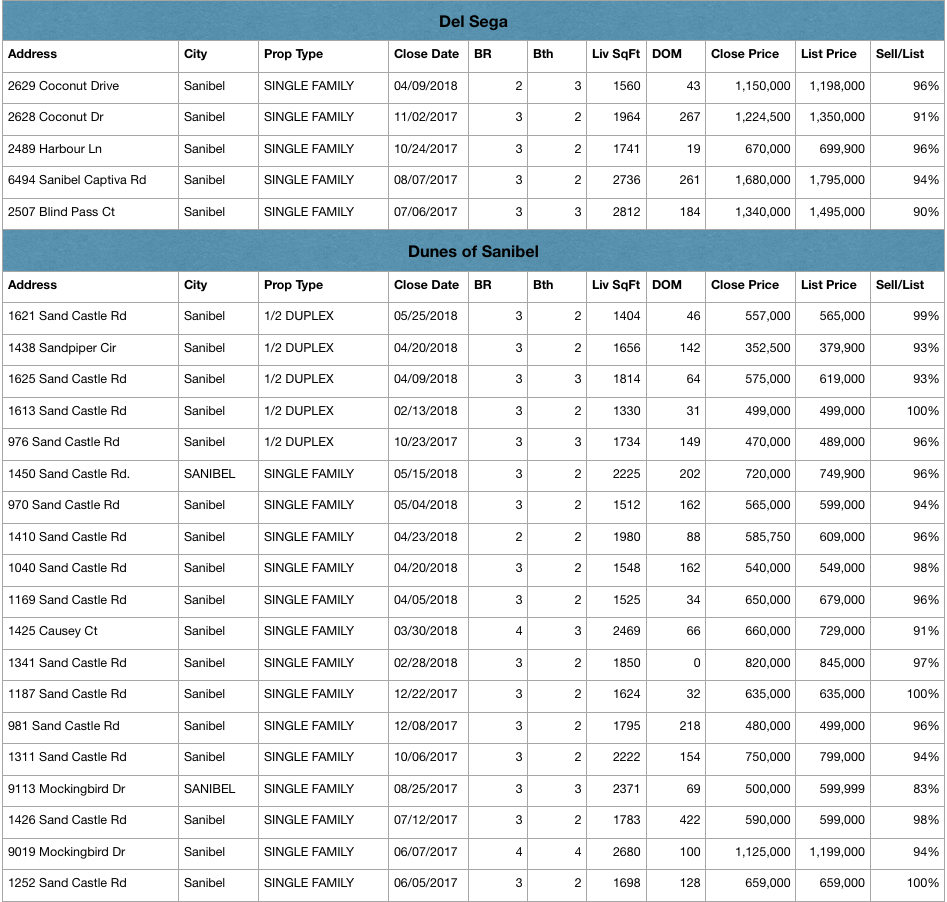
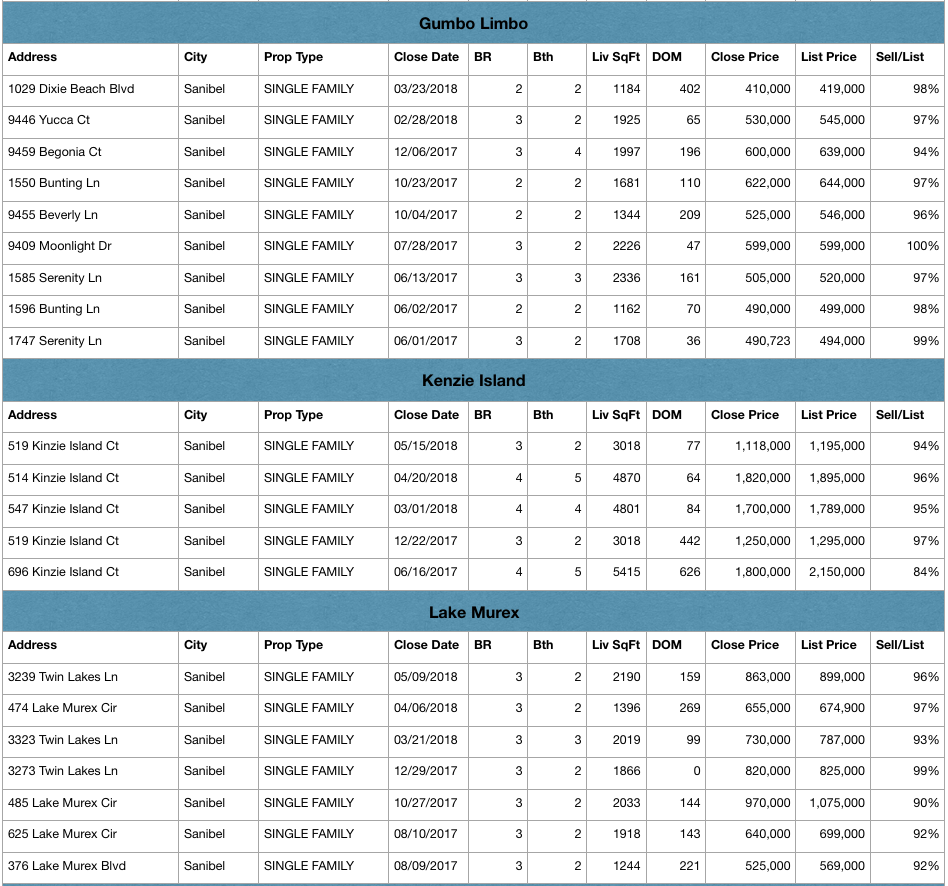
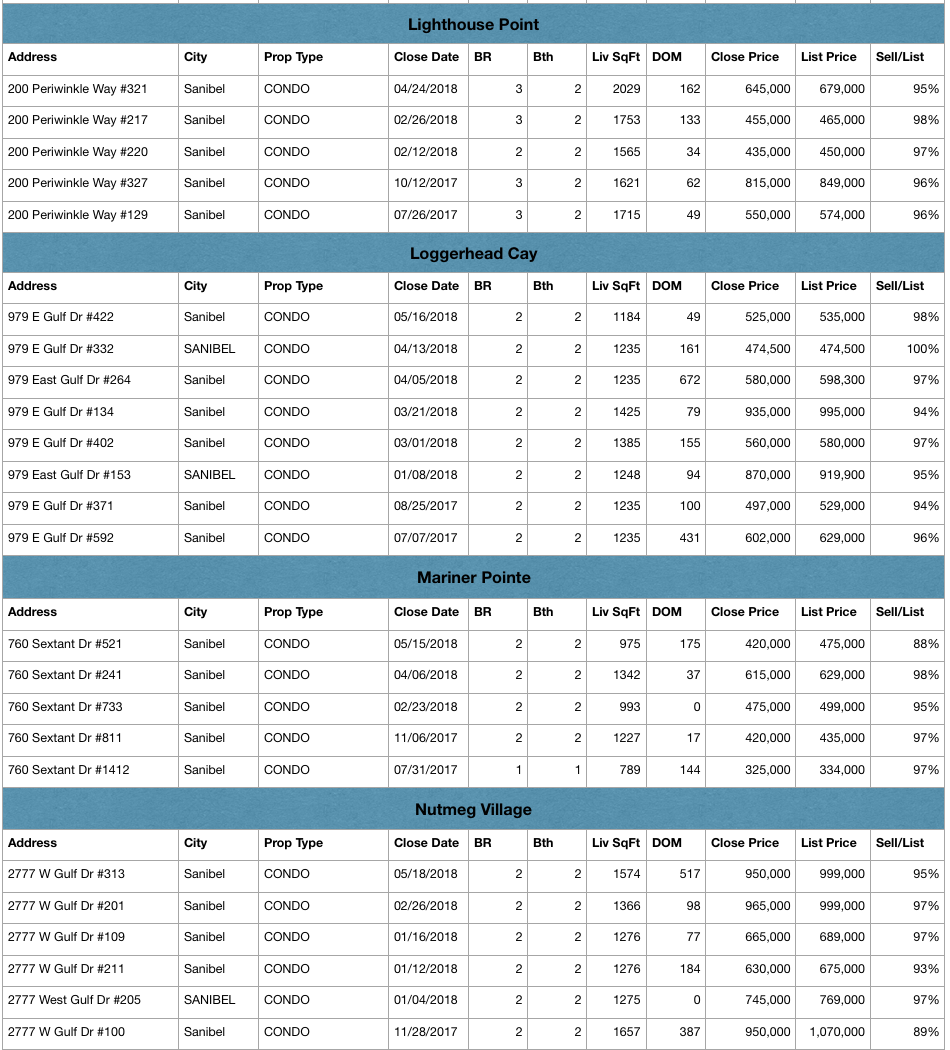
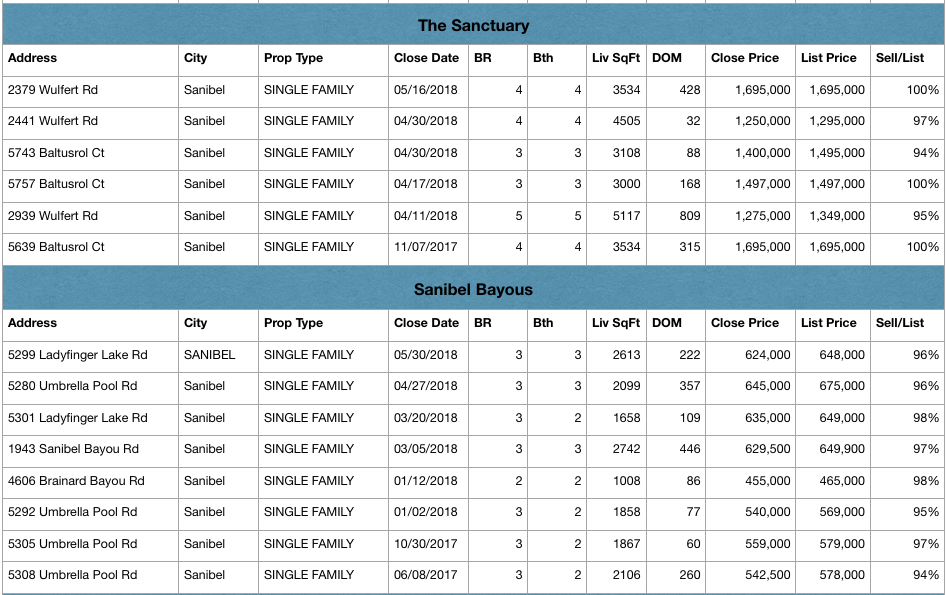
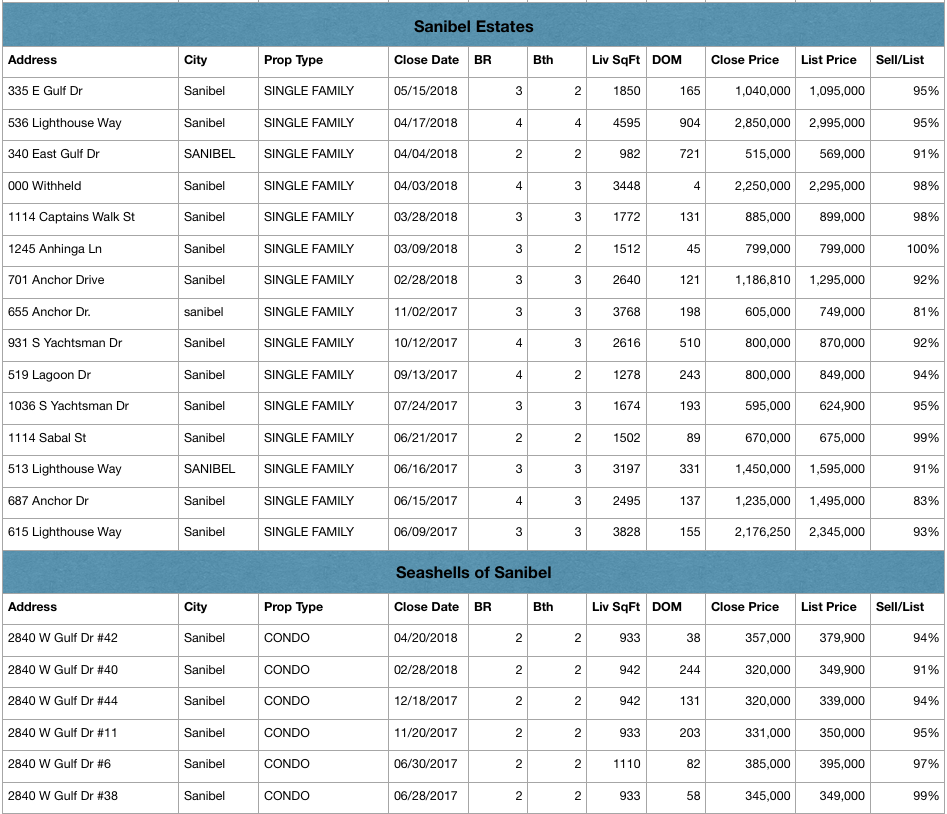
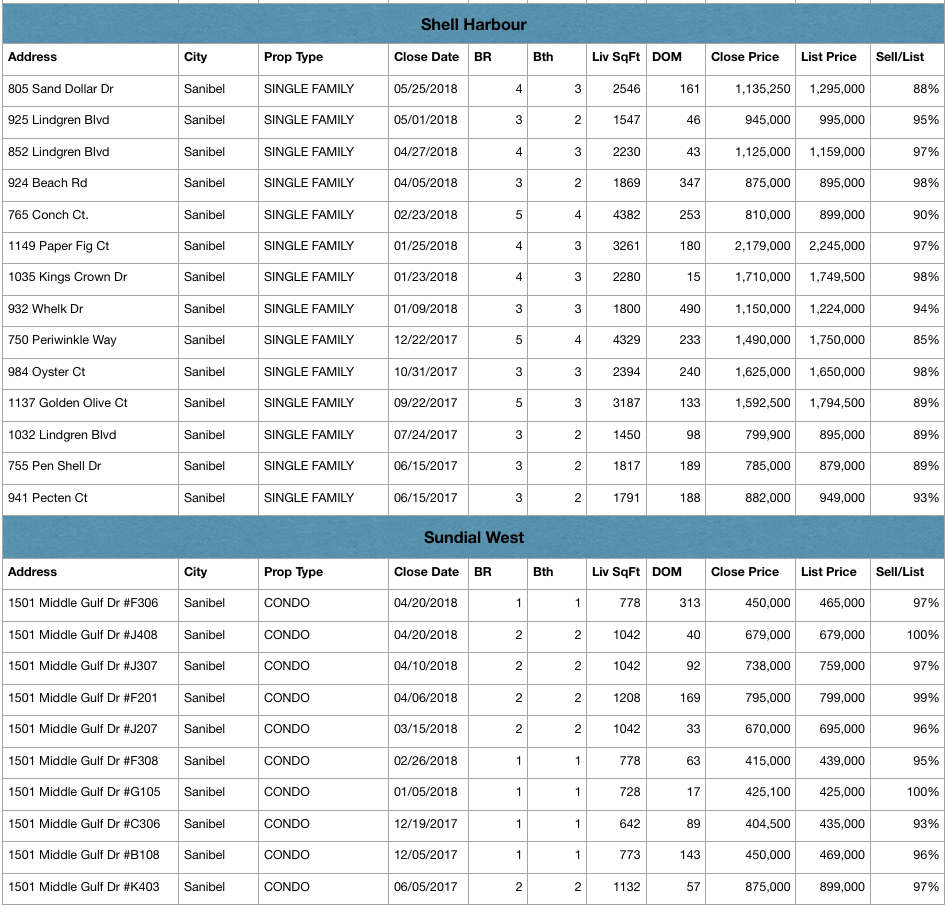
Care to dive deeper into the sales data of these communities? We’ve listed each sale in detail below. Again, these home sales happened from June 1, 2017 – June 1, 2018, with data taken from the Sanibel-Captiva MLS on June 25, 2018.

Screen Shot 2018-06-26 at 10.04.19 AM Screen Shot 2018-06-26 at 10.06.54 AM Screen Shot 2018-06-26 at 10.07.06 AMScreen Shot 2018-06-26 at 10.10.19 AMScreen Shot 2018-06-26 at 10.07.45 AM Screen Shot 2018-06-26 at 10.07.58 AM Screen Shot 2018-06-26 at 10.08.09 AM

Interested in a different neighborhood? We’re happy to share the recent sales data for any given community. Just give us a shout and we’ll look that up for you! 239-472-1950 or team@mccallionrealty.com

Written by: Jim McCallion

Tagged With: market stats, pricing Filed Under: Market Update, Real Estate News

About Jim McCallion

Meet the "Marketing Megaphone" and Webmaster behind McCallion & McCallion. After selling his software company, Jim, Susan and kids moved to Sanibel in 2008. With his tech experience, he and Susan bring a fresh approach to island real estate.

Primary Sidebar

Recent Posts

  • Mastering Curb Appeal
  • Pros and Cons of Living on Sanibel Island
  • Sanibel Pool Homes For Sale
  • Is It Time To Downsize?
  • Sanibel Island Population

Explore more

McCallion & McCallion Realty Logo

McCallion & McCallion Realty
1640 Periwinkle Way, Suite 1
Sanibel Island, Florida 33957
(239) 472-1950

  • email us
  • facebook
  • instagram
  • pinterest
McCallion & McCallion Realty Logo
(239) 472-1950 email us facebook instagram pinterest
Copyright © · Susan McCallion · Broker · McCallion & McCallion · Sanibel Real Estate · Listings · Sitemap