
Real estate prices have certainly increased since the crash in 2009. But the real estate recovery is significantly different depending on where the property is located. Remember, all real estate is local! That said, Freddie Mac publishes a House Price Index that we have analyzed by state to reveal the number of states whose home price index has superseded the pre-2008 peak, versus the number of states that are still below the pre-crash peak and those that are right at the peak point.
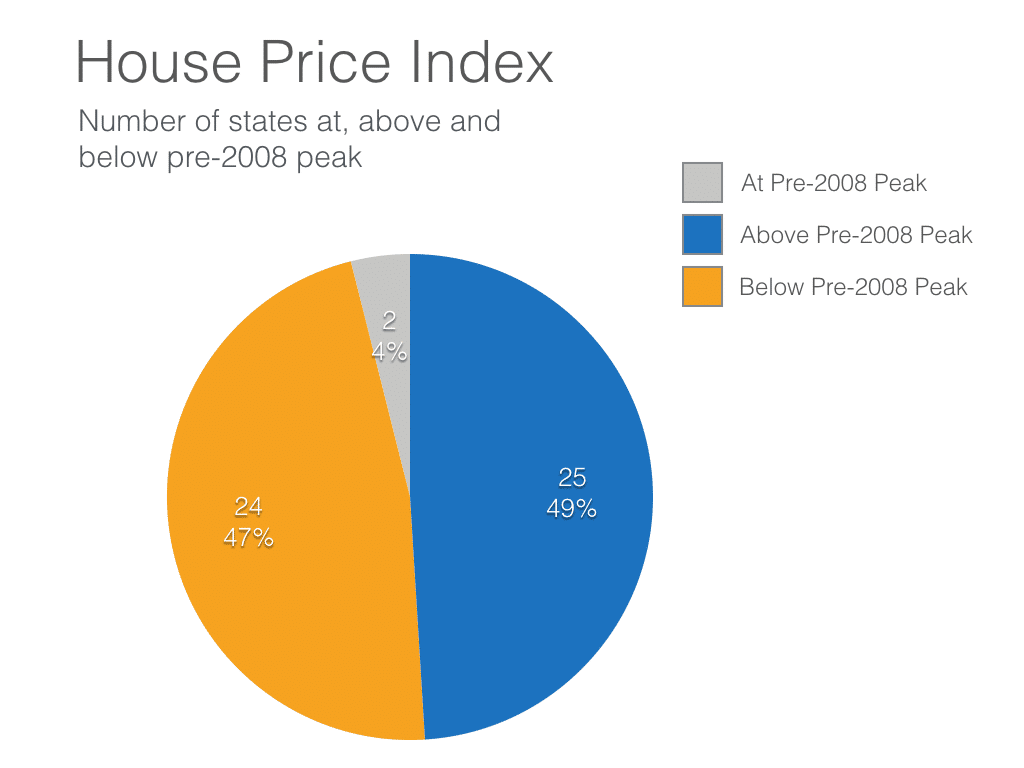
As you can see, just about half of the states’ home prices are above and half are below where they were before the crash. The chart below breaks out the percentage amount that each state is either above or below compared to their pre-2008 peak.
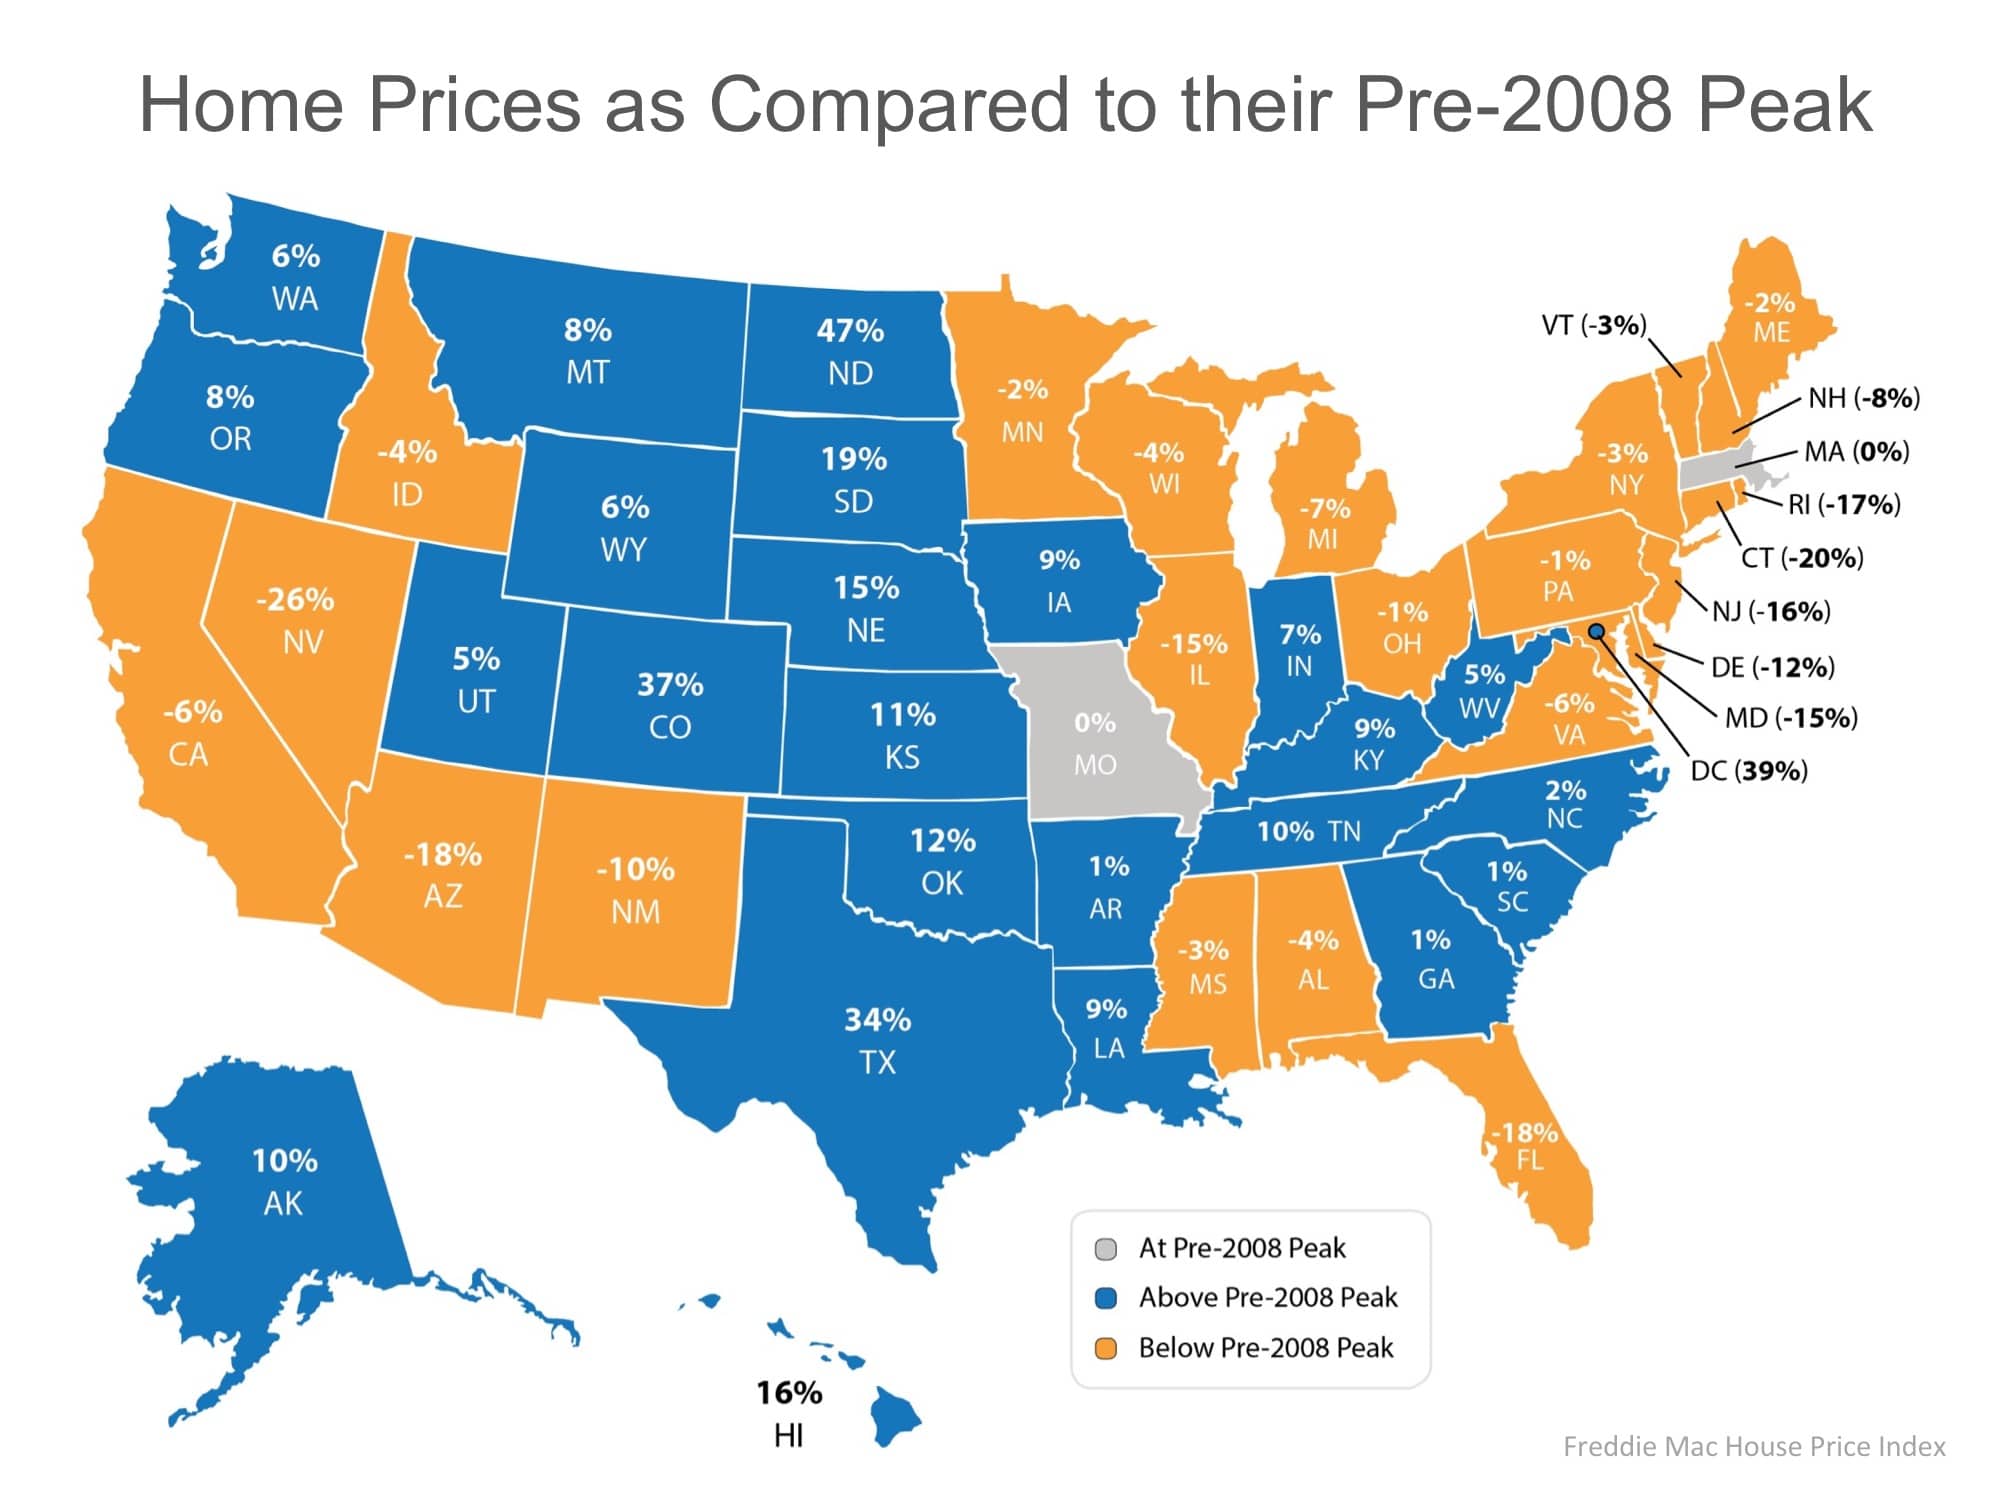
Florida, Arizona, Nevada and Connecticut have the furthest distance to go to reach their pre-2008 peak. Each of these states’ home price index is at least 18% below where it was before the crash. On the opposite end, Texas, Colorado, North Dakota and the District of Columbia have the highest percentage above their pre-2008 peak point. Each of these areas’ home price index is at least 34% above where they were before the crash.
With that said, Florida is in the Top 5 States that have the highest Annual House Price Appreciation Percentage. The list below includes the states that have seen the largest percent change in home prices during the past year.
Biggest Home Price Gains June 2015 to June 2016
- Oregon (12.7%)
- Washington (12.4%)
- Colorado (10.9%)
- Florida (10.7%)
- Nevada (9.9%)
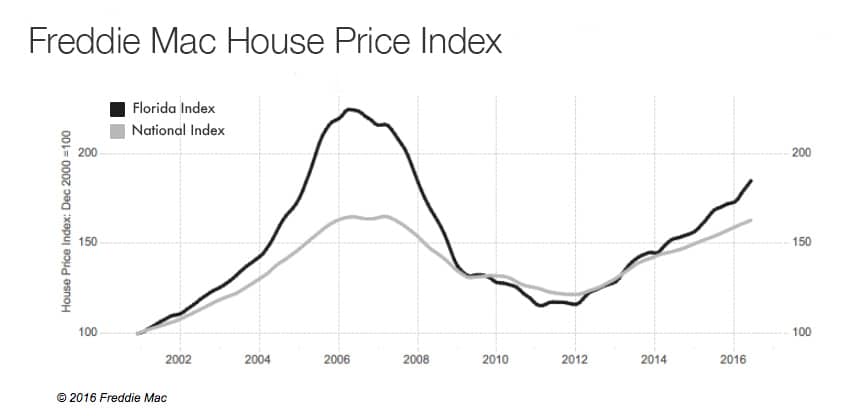
Below, the graph shows home values in the state of Florida are steadily climbing back from the market lows in 2012. While the annual increase is consistent, statewide, we have not reached the prices of 10 years ago.
I found these charts and graphs on the turn around very interesting, but hey, I’m a numbers guy! It’s important to keep in mind that a number of variables go into these statistics. For example, some states might not have been as drastically effected by the crash as other states, therefore, having less of a gap to close in the turn around.
So, while these charts are great to get an overview of the market happenings, remember that each state, and even different areas within each state has experienced a different scenario over the past ten years. All in all, I’m excited to see where the market will lead us over the next year.